Polkadot price springs higher on Coinbase listing, but beware of DOT risks
- Polkadot price jumped 17.4% on Monday following the news that Coinbase Pro will finally allow trading on June 16.
- DOT stalls once again at resistance, stretching from the February 23 low at $25.87.
- 200-day simple moving average (SMA) remains instructive for support and resistance.

Polkadot price welcomed the Coinbase Pro announcement, delivering the highest daily volume for a positive day since May 26 and the largest daily gain since May 24. The resulting spike above the 200-day SMA was a bullish development, but it faded when DOT pressed against a longstanding barrier. The outlook is neutral, waiting for further catalysts to overcome the notable resistance.
Coinbase Pro listing creates higher expectations and excitement for DOT investors
DOT faithful were met with good news on Monday as Coinbase pro announced support for Polkadot within its Coinbase Pro offering beginning on June 16. Coinbase is the dominant US-based cryptocurrency exchange and ranks among the largest in the world.
The announcement published on the Coinbase Blog revealed that Coinbase Pro had listed DOT, and users can transfer the cryptocurrency to their accounts. The altcoin will be available in all jurisdictions that support Coinbase, except Singapore. Official trading will commence on or after 9am Pacific Time (PT) Wednesday, June 16, if liquidity conditions are met.
An essential component of the announcement is liquidity and how it will work in the order books.
If at any point one of the new order books does not meet our assessment for a healthy and orderly market, we may keep the book in one state for a longer period of time or suspend trading as per our Trading Rules.
DOT will not be available on Coinbase.com or via the Consumer mobile apps, but it assured investors that it would keep them abreast through their Twitter account when each phase mentioned is passed.
Polkadot joins a large number of tokens that have been recently added to Coinbase, including Dogecoin (DOGE), Internet Computer (ICP), Mirror Protocol (MIR), Tellor (TRB) and Gitcoin (GTC).
Polkadot is a protocol that enables cross-blockchain transfers of any data or asset. By combining multiple blockchains, Polkadot aims to realize high degrees of security and scalability. DOT is the protocol’s token and can be used for staking to secure the network or to connect new chains.
Polkadot price faces some challenging technical obstacles
May was an electrifying month for Polkadot price as it crashed over 70% from May 15 high at $50.74 to the May 23 low at $13.59, including a 60% collapse on May 19 before rebounding to close down 38%. The low of the correction exceeded the 78.6% Fibonacci retracement of the 2021 rally at $14.89.
Polkadot price has been trading with an increasingly tighter range instructed by the 200-day SMA, constructing a symmetrical triangle in the process. The majority of the triangle lies below a price barrier that originates at the February 23 low at $25.87 and extends through April 23 low at $25.82. The resistance has contained several rally attempts since the May 23 low and halted yesterday’s rally.
Symmetrical triangles are generally regarded as continuation patterns, so Polkadot price needs a daily close above the $25.82-$25.87 hurdle and the triangle’s upper trend line at $27.25 to rethink the neutral to bearish DOT narrative outlined by the symmetrical triangle. A daily close above the 38.2% retracement of the May correction at $27.78 would be added confirmation.
A refreshed DOT could target the 50% retracement at $32.16 and the 61.8% retracement at $36.54, but it will not be easy due to the price congestion around the range beginning in February.
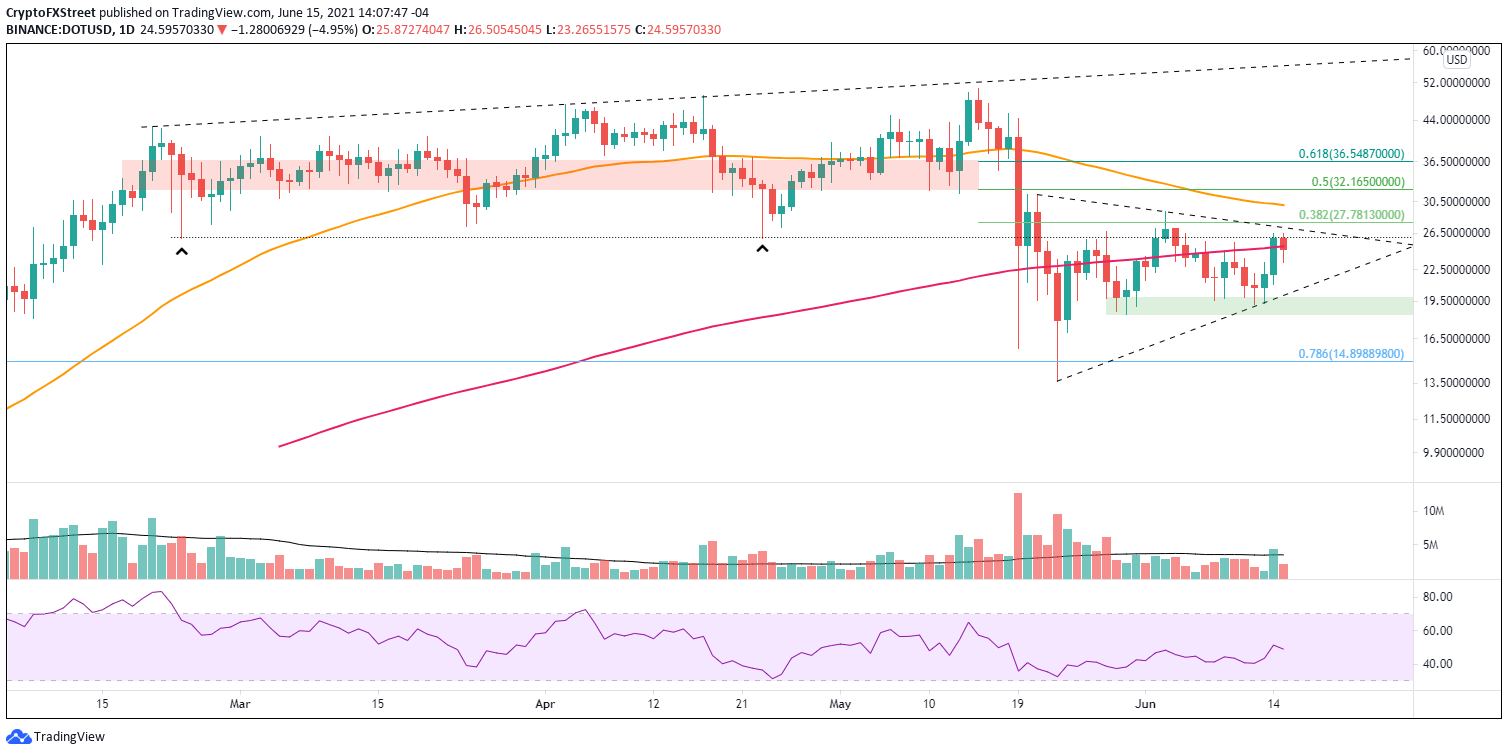
DOT/USD daily chart
If Polkadot price preference is to continue the correction, DOT will need a close below the triangle’s lower trend line at $20.10 to certify a bearish resolution. Some price congestion lies below $20.10 that may temporarily interrupt the decline before the digital asset tries to sweep the May 23 low at $13.59.
DOT investors are primed as one of the largest cryptocurrency exchanges will be listing the altcoin, and they have reason to be excited. According to Messari, a cryptocurrency analysis firm, there is a Coinbase price pop phenomenon during the first five days of trading. Of course, not all cryptocurrencies rally, but the firm has shown that “Coinbase listings have the highest average return at 91%” compared to other digital-market venues over the first five days.
Polkadot price is not free from the technical restrictions that have dominated DOT for weeks, but the Coinbase listing may still be the trigger to reopen a path to the all-time high at $50.75.
Author

Sheldon McIntyre, CMT
Independent Analyst
Sheldon has 24 years of investment experience holding various positions in companies based in the United States and Chile. His core competencies include BRIC and G-10 equity markets, swing and position trading and technical analysis.



