Polkadot Price Prediction: DOT faces mounting overhead pressure slowing its ascent
- Polkadot price is approaching a critical level after surging 30% from its recent swing low.
- The MRI shows a preemptive top signal, indicating a reversal might be arriving shortly.
- The resistance level at $38.70 and the supply zone ranging from $42 to $44.06 will be crucial in establishing a trend for DOT.

Polkadot price was on a constant upswing since the crash a few weeks ago. However, DOT is currently sitting below stiff resistance levels that could invoke a downswing.
Polkadot price slows down
Polkadot price has recouped nearly 50% of its losses after the market crash between April 17 and April 23. While an upswing seems likely, investors should note that the resistance level at $38.70 will hinder any bullish momentum.
If this barrier is cleared, the supply zone, extending from $42 to $44.06, will be the next point of contention. The Momentum Reversal Indicator’s preemptive top signal in the form of a yellow arrow on the current 12-hour candlestick adds to this bearish picture.
Additionally, the 50 and 100 twelve-hour Simple Moving Averages (SMA) at $37.05 will play a pivotal role. A decisive close below the SMAs or rejection at any of these levels will lead to a correction toward the demand barrier that stretches from $32.56 to $34.25.
While this scenario is not bullish per se, it will allow the buyers to recuperate for the next leg. However, a breakdown of the 200 SMA at $32.58 will invoke a massive bearish outlook that could push Polkadot price to $27.95.
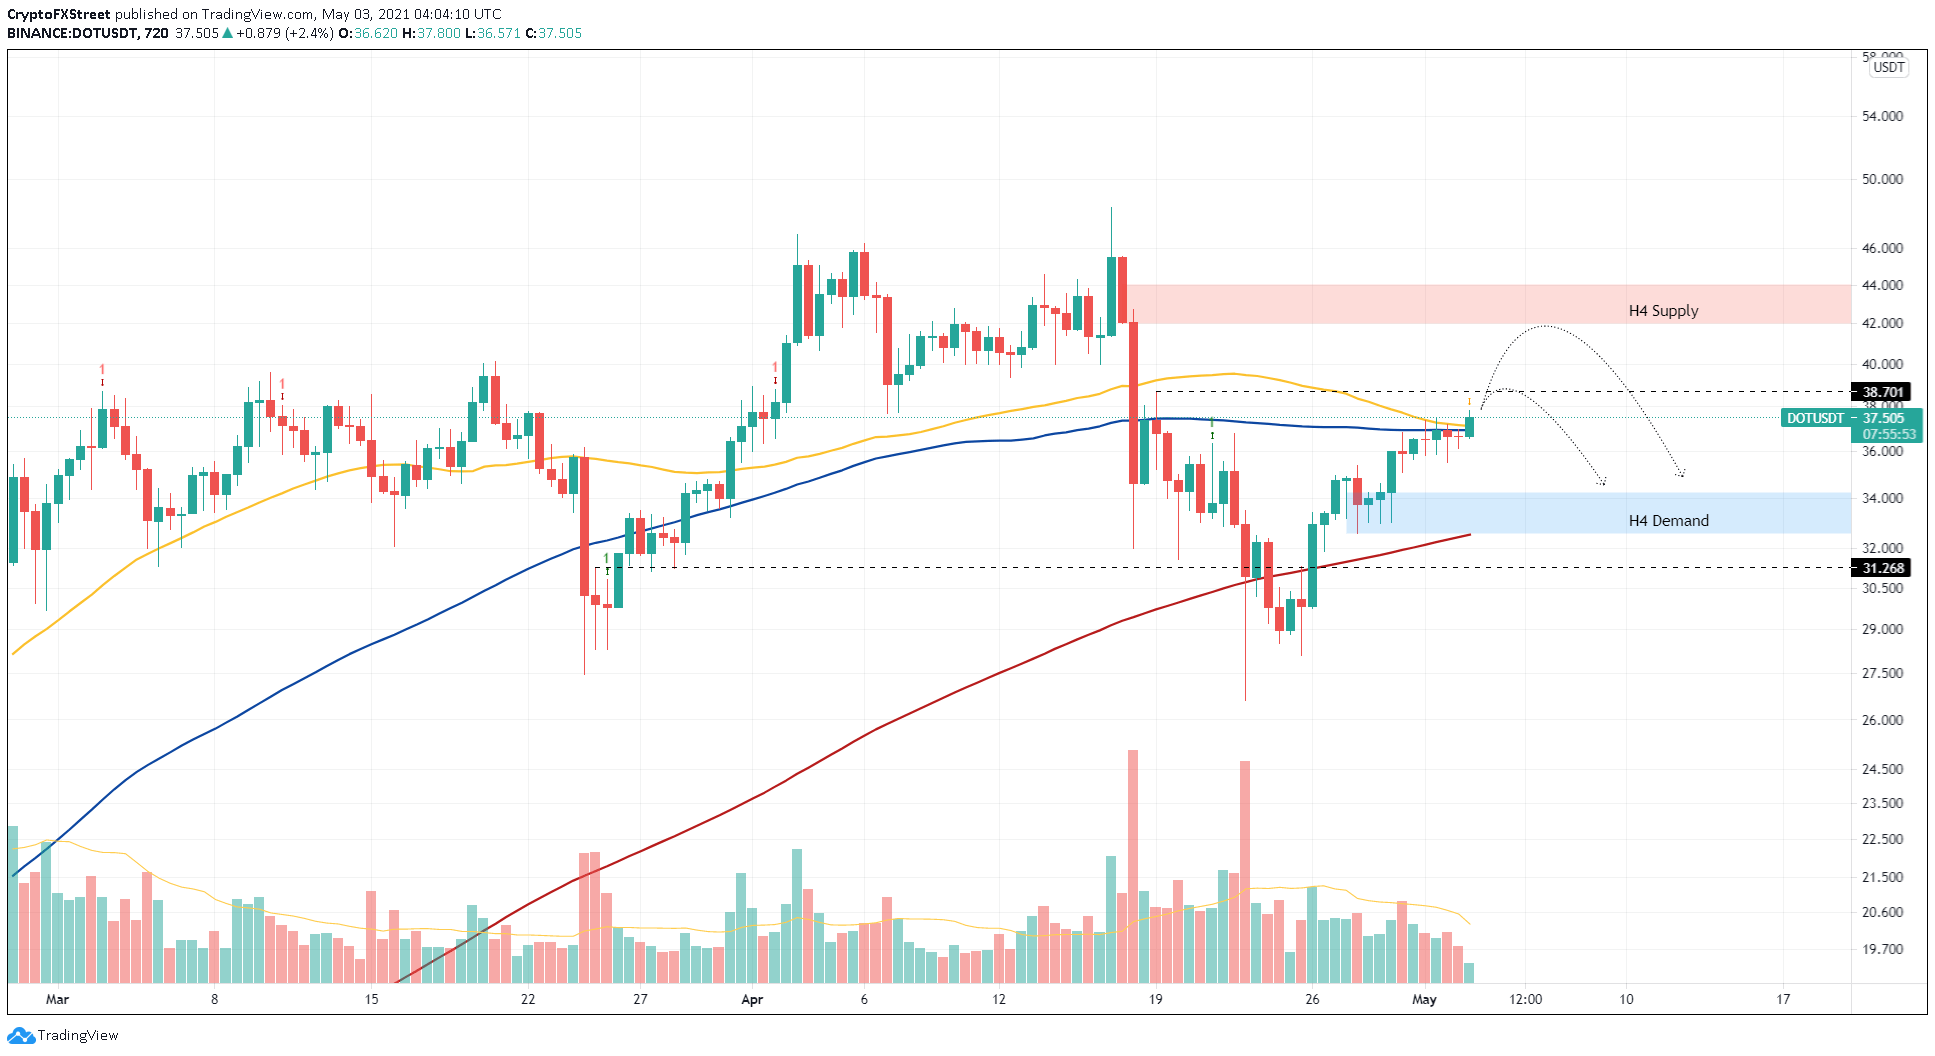
DOT/USDT 12-hour chart
While the upswing does not seem likely from a technical standpoint, investors should note that a potential spike in buying pressure that results in a decisive 12-hour candlestick close above the supply zone’s upper trend line at $44.06 will kick-start an uptrend.
Under these circumstances, Polkadot price could surge another 10% to retest its all-time high at $48.36.
Author

Akash Girimath
FXStreet
Akash Girimath is a Mechanical Engineer interested in the chaos of the financial markets. Trying to make sense of this convoluted yet fascinating space, he switched his engineering job to become a crypto reporter and analyst.




