Polkadot price in search of a catalyst, as DOT struggles with overhead resistance
- Polkadot price strength being compromised by the intersection of two resistance levels.
- Rebound may be disguising the next leg of a bearish pattern.
- Osprey Funds broadens market for alternative cryptocurrency funds.

Polkadot price rebound at a crossroads, leaving market operators bewildered and frustrated as other cryptocurrencies sprint towards new highs. In the short term, the pattern presents the potential for a 20% rally from the current price if resistance levels are overpowered.
Polkadot price future to be influenced by a new generation of crypto investors
The new Osprey Polkadot Trust caters to sophisticated investors searching for a unique opportunity to access one of the largest layer one smart contract chains. The fund will be available to high-net-worth individuals with an investment minimum of $25,000, and it will list on the OTCQX market as soon as possible.
DOT began 2021 with an impressive rally, but from mid-February, the cryptocurrency has primarily moved sideways, except for a minor new high in the middle of April. The new high was matched with a bearish momentum divergence, as the Relative Strength Index (RSI) on various timeframes failed to print a new high. The ensuing correction traveled to the 50% retracement of the advance that began on December 23, 2020, resulting in a 40% decline.
From a macro perspective, a potential head-and-shoulders top is lurking on the 12-hour chart. To complete the pattern and to provide symmetry, DOT needs to shrug off the resistance at the crossroads of the double top trigger at $37.71 and the 100 twelve-hour simple moving average (SMA) at $36.93 to reach a similar high as the left shoulder around $42.36. It would equate to a 20% gain from the current price.
To further add symmetry, the right shoulder could take weeks to complete, as was the case with the left shoulder, bolstering the credibility of the pattern that ranks very high in terms of success and returns if adequately formed
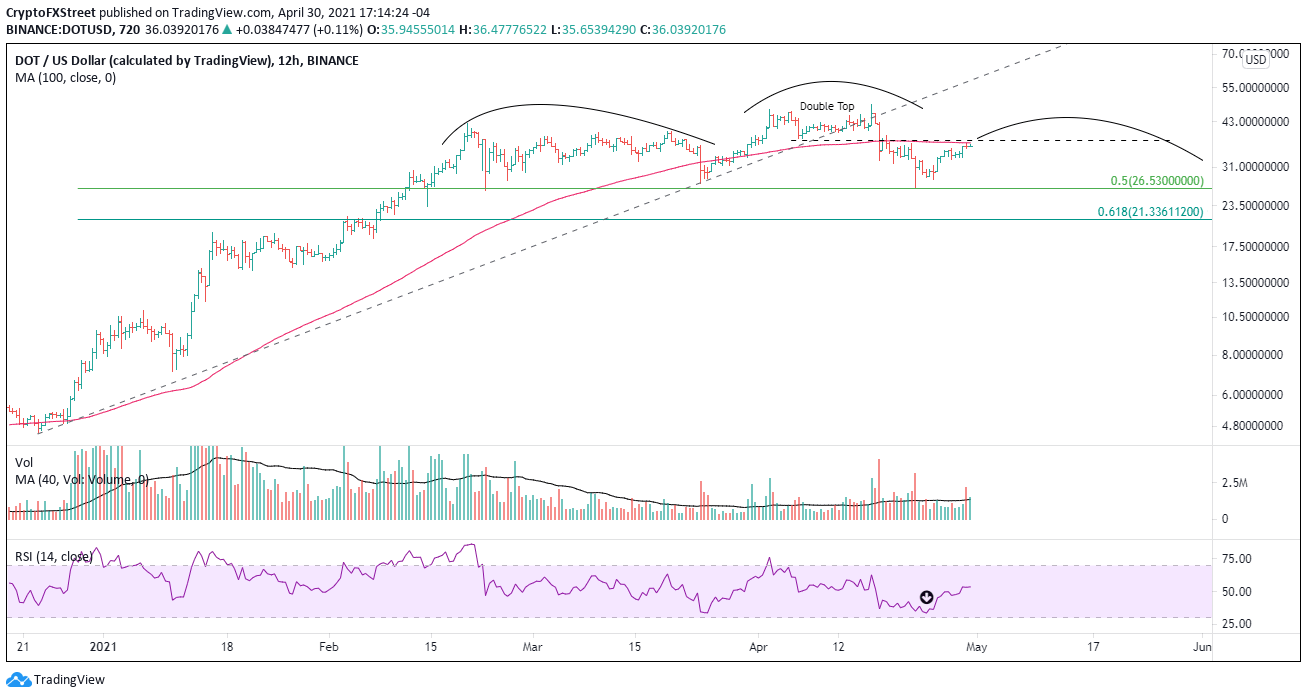
DOT/USD 12-hour chart
The bearish thesis is voided if DOT rallies beyond the April high at $48.54. A surge beyond the high will collide with the meridian trend line beginning at the end of December 2020 and through the March low. The trend line currently rests at $58.25.
Author

Sheldon McIntyre, CMT
Independent Analyst
Sheldon has 24 years of investment experience holding various positions in companies based in the United States and Chile. His core competencies include BRIC and G-10 equity markets, swing and position trading and technical analysis.


