Polkadot Price Prediction: DOT buy signal suggests new all-time high above $70
- Polkadot price has been consolidating under $48.33 for roughly four days, suggesting a breakout is likely.
- A daily close above $48.33 will propel DOT to a new all-time high potential at $71.43
- A daily close below $39.63 will invalidate the bullish thesis.

Polkadot price has been trading in a tight range since November 11. However, one indicator suggests that a bullish breakout is likely. This potential move could set a new all-time high for DOT.
Polkadot price looks ready for a breakout
Polkadot price rose 33% between November 1 and November 4 to set a new high at $55.22. This upswing was followed by massive profit-taking that led DOT to retrace its move. Since then, DOT has been tapping the $39.63 to $45.79 demand zone but stuck under the $48.33 resistance barrier, suggesting a lack of volatility.
Therefore, investors can expect Polkadot price to experience a volatile move, potentially to the upside. The Momentum Reversal Indicator (MRI)’s green ‘one’ buy signal on the daily chart supports this thesis. This technical formation forecasts a one-to-four candlestick upswing.
Therefore, a daily close above $48.33 will confirm the start of an upswing. Moreover, a higher high above $55.88 will solidify the bullish move.
In this scenario, market participants can expect Polkadot price to extend its leg-up to $71.43, coinciding with the 161.8% Fibonacci extension level. This new all-time high for DOT could end here, or in a highly bullish case, Polkadot price might target the next level at $100, coinciding with the 261.8% Fibonacci extension level.
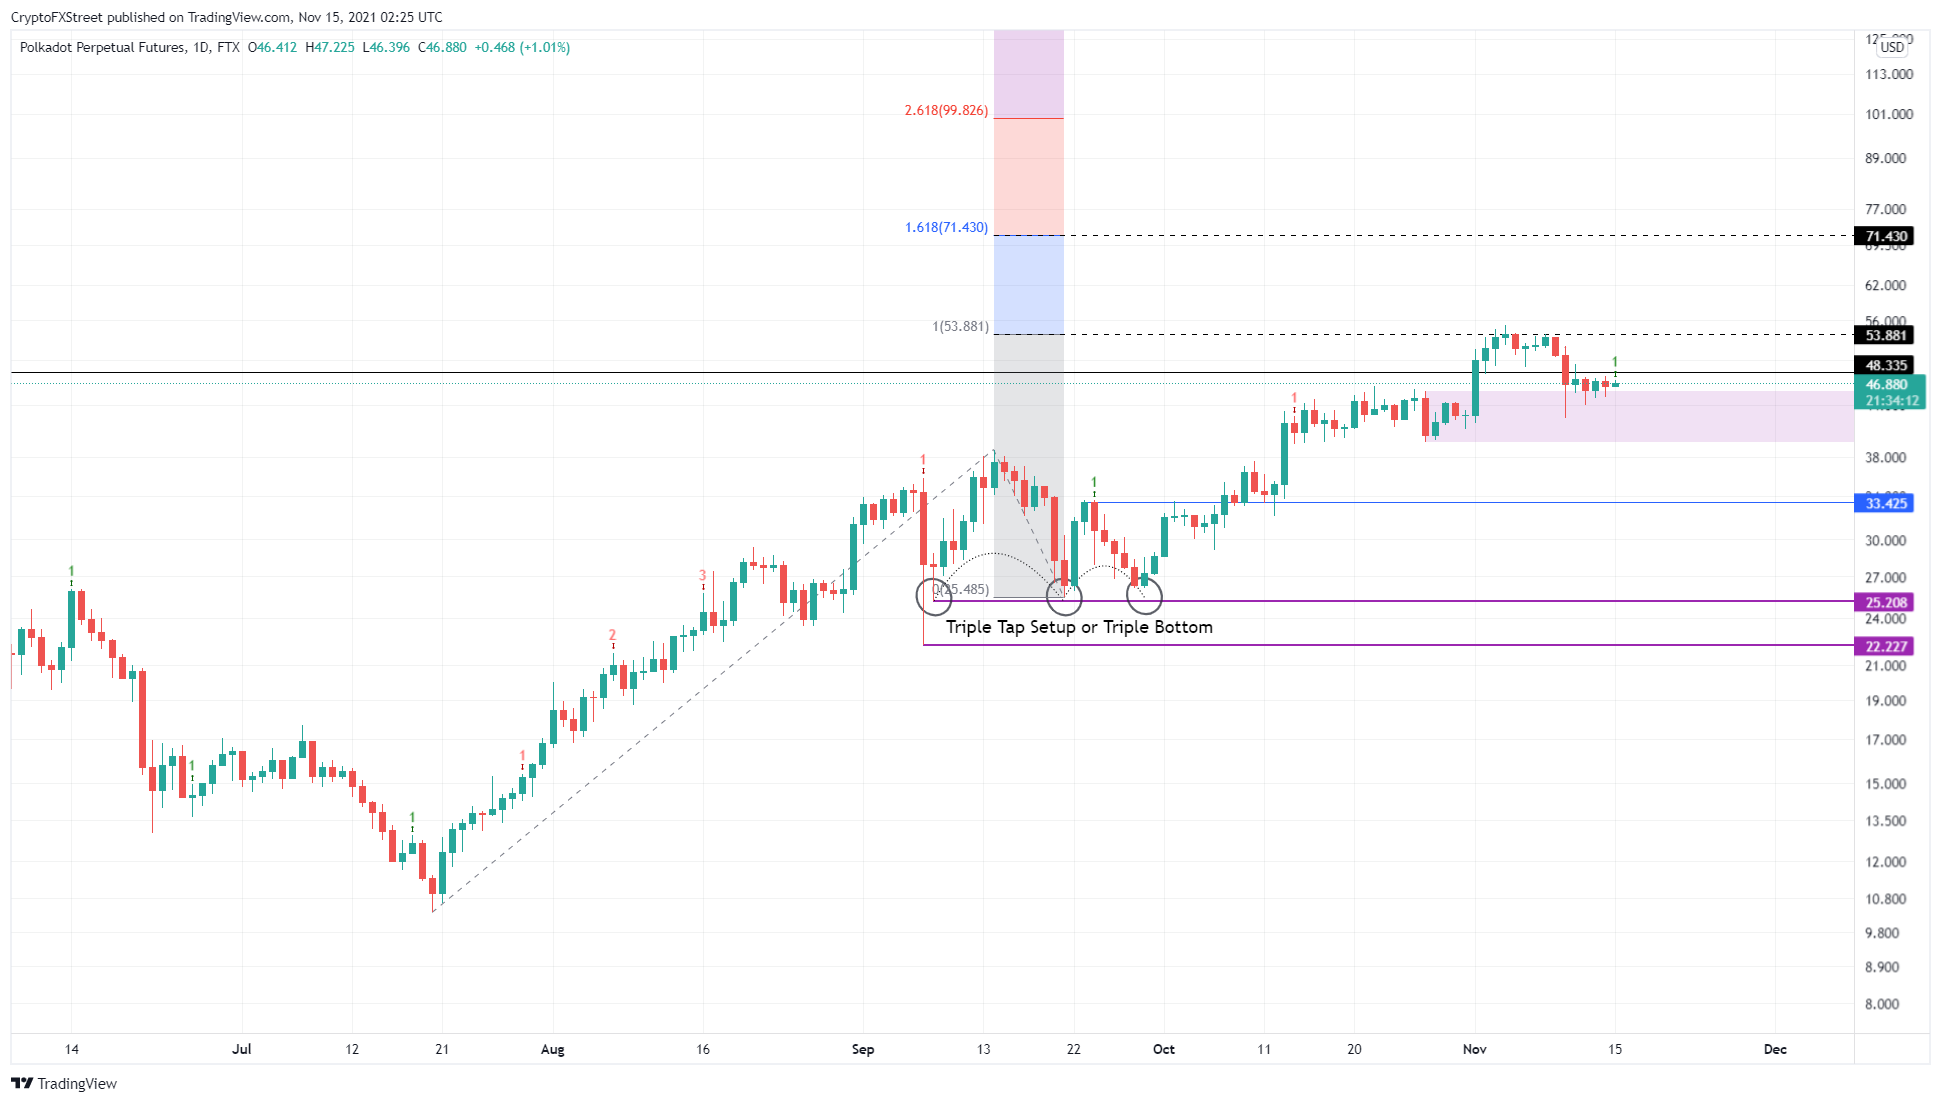
DOT/USDT 1-day chart
Regardless of the buy signal, if Polkadot price pushes through the $39.63 to $45.79 demand zone, things will be primed for a lower move. A daily close below $39.63 will invalidate the bullish thesis.
In this scenario, Polkadot price could head lower to the $33.42 support floor, where it could give the upswing another go.
Author

Akash Girimath
FXStreet
Akash Girimath is a Mechanical Engineer interested in the chaos of the financial markets. Trying to make sense of this convoluted yet fascinating space, he switched his engineering job to become a crypto reporter and analyst.


