Polkadot Price Prediction: 15% gain in sight with DOT on track to complete a path to perfection


  • Polkadot price broke out of a falling wedge pattern, rising 82% to a multi-month high.
  • DOT could climb 15% to reclaim the $8.6090 level as part of a full-cycle healthy retest.
  • The bullish thesis will be invalidated if the altcoin breaks and closes below the midline of the order block at $6.6010.

Polkadot (DOT) price is trading with a bullish bias, nurturing a recovery rally after a recent correction. It comes amid broader market bullishness, led by Bitcoin, with altcoins following behind for directional bias.

Also Read: Altcoins follow as BTC shows no signs of stopping

Polkadot price eyes 15% climb

Polkadot (DOT) price is nurturing a V-shaped recovery, after bouncing into a strong order block for what crypto trader and analyst Rekt Capital calls a “successful retest.”

DOT price could extend the gains 15% to reclaim the $8.6090 local top, steered by bullish technicals. For starters, the position of the Relative Strength Index (RSI) at 60 shows there is still more room north before DOT is considered overbought.

The Moving Average Convergence Divergence (MACD) is also in negative territory, suggesting the bulls maintain a strong presence in the market.

In a highly bullish case, Polkadot price could extend the gains to the $9.0000 psychological level.

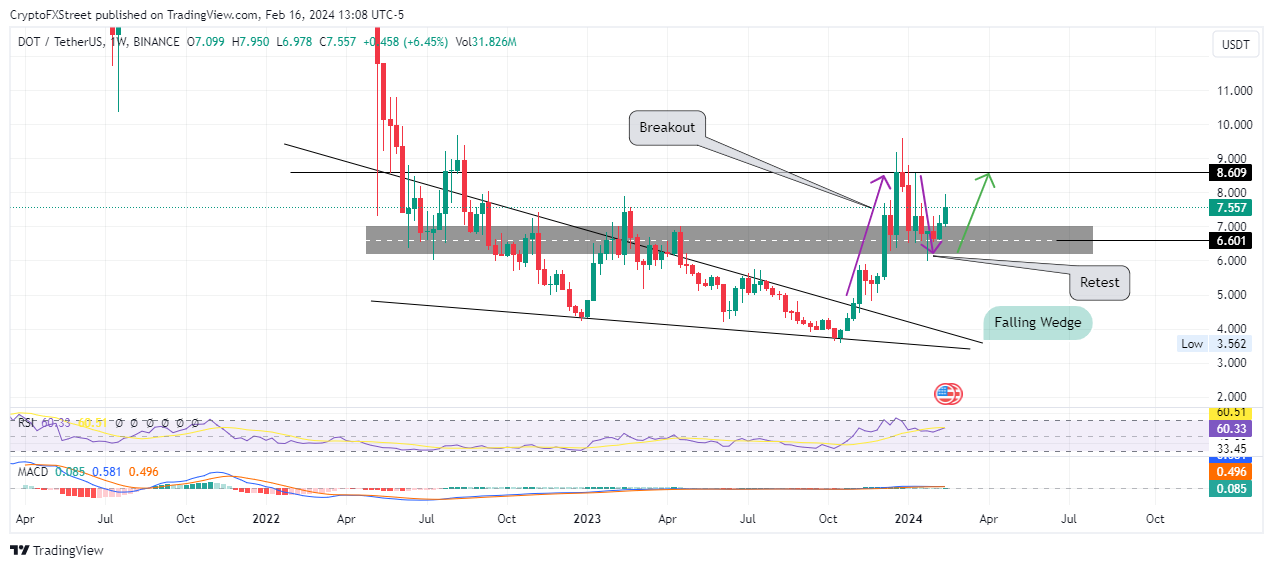
DOT/USDT 1-day chart

Conversely, if traders cash in on the gains made over the last two days, Polkadot price could drop with a break and close below the $6.6010 centerline confirming the continuation of the downtrend.

In a dire case, Polkadot price could roll over to the $6.0000 psychological level. Such a move would denote a 20% fall below current levels.


Information on these pages contains forward-looking statements that involve risks and uncertainties. Markets and instruments profiled on this page are for informational purposes only and should not in any way come across as a recommendation to buy or sell in these assets. You should do your own thorough research before making any investment decisions. FXStreet does not in any way guarantee that this information is free from mistakes, errors, or material misstatements. It also does not guarantee that this information is of a timely nature. Investing in Open Markets involves a great deal of risk, including the loss of all or a portion of your investment, as well as emotional distress. All risks, losses and costs associated with investing, including total loss of principal, are your responsibility. The views and opinions expressed in this article are those of the authors and do not necessarily reflect the official policy or position of FXStreet nor its advertisers. The author will not be held responsible for information that is found at the end of links posted on this page.

If not otherwise explicitly mentioned in the body of the article, at the time of writing, the author has no position in any stock mentioned in this article and no business relationship with any company mentioned. The author has not received compensation for writing this article, other than from FXStreet.

FXStreet and the author do not provide personalized recommendations. The author makes no representations as to the accuracy, completeness, or suitability of this information. FXStreet and the author will not be liable for any errors, omissions or any losses, injuries or damages arising from this information and its display or use. Errors and omissions excepted.

The author and FXStreet are not registered investment advisors and nothing in this article is intended to be investment advice.

Join Telegram

Recommended content


Recommended Content

Editors’ Picks

Could Worldcoin price shoot up 45% ahead of OpenAI’s live stream on Monday?

Could Worldcoin price shoot up 45% ahead of OpenAI’s live stream on Monday?

Worldcoin has formed a double bottom around a key support level, suggesting a potential accumulation. If the OpenAI’s Monday live stream has a positive impact on Artificial Intelligence field, it could positively impact WLD and other AI-based tokens. 

More Worldcoin News

Here’s what needs to happen for The Graph price to revisit $0.422

Here’s what needs to happen for The Graph price to revisit $0.422

The Graph price trades inside the $0.192 to $0.494 range. Investors need to wait for GRT to overcome $0.343 before being bullish on GRT. If successful, GRT could rally 50% and revisit the $0.422 hurdle. A decisive daily candlestick close below $0.192 will invalidate the bullish thesis.

More The Graph News

SingularityNET price could bounce 30% if AGIX can hold this level

SingularityNET price could bounce 30% if AGIX can hold this level

SingularityNET price has been consolidating around the bottom of the $0.903 to $1.475 range for nearly a month. With some AI-tokens showing signs of revival, AGIX needs to be enalyzed for potential breakout opportunities like Arkham (ARKM).

More SingularityNET News

Arkham price primed for a recovery rally ahead of OpenAI’s announcement

Arkham price primed for a recovery rally ahead of OpenAI’s announcement

Arkham price eyes a potential reversal as it clears key hurdles. ARKM likely to rally 27% if it can overcome $2.74 resistance level. A breakdown of $2.28 wil invalidate the bullish thesis for the AI-based token.

More Arkham News

Bitcoin: Why BTC is close to a bottom

Bitcoin: Why BTC is close to a bottom

Bitcoin (BTC) price efforts of a recovery this week have been countered by selling pressure during the onset of the American session. However, the downside potential appears to have been capped. 

Read full analysis

BTC

ETH

XRP