Polkadot price could plummet below $6 despite a successful year for DOT’s parachains
- Polkadot project is celebrating a year of parachains in its ecosystem that drive a broad range of cross-chain, interoperable web3 integrations.
- DOT price wiped out its gains from the past two weeks, amidst crypto market bloodbath.
- Polkadot’s token is at a risk of decline below the $6 level after yielding nearly 10% losses since February 9.

Polkadot, multichain for web3, is celebrating a year of parachains, blockchains connected to the DOT ecosystem. DOT price plummeted nearly 10% since February 9, analysts predict further decline in the web3 protocol’s native token.
Polkadot smart chain celebrates a year of parallel blockchains in its ecosystem
Polkadot is an Ethereum competitor and an ecosystem of smart contract parachains, parallel blockchains in the DOT ecosystem.
The top parachains, Moonbeam Network, Astar Network and Acala Network, won the first three auctions and drove a broad range of cross-chain, interoperable web3 integrations.
Several projects in the DeFi ecosystem emerged winners in Polkadot’s auctions, running parallel blockchains alongside DOT’s native chain.
1/ Continuing our series celebrating the first full year of parachains on Polkadot, let’s move on from DeFi to System Chains, Smart Contracts, and Social Media.
— Polkadot (@Polkadot) February 10, 2023
Read the thread and an in-depth blog for more detail on these exciting use cases: https://t.co/WToBrCsAGu pic.twitter.com/IyTVskQf3W
Despite bullish developments in its ecosystem and powering multiple DeFi and smart contract blockchain projects, DOT price is struggling to recoup its losses. DOT price yielded 8.7% losses since February 9.
DOT price is at risk of collapse below the $6 level
DOT, the native token of the Polkadot ecosystem wiped its weekly gains with the recent decline to $6.26. The token is currently trading at its weekly low and DOT price is at risk of decline below the $6 level.
On the 1D timeframe, DOT is in a multi-month downtrend, on the 4H chart, it is in an uptrend in an ascending channel.
The chart below shows the formation of a support zone between $6.22 and $6.59. DOT declined below the lower trendline forming the support zone and nosedived below the volume point-of-control (POC) at $6.22.
The Volume POC is a key level as it represents the price with the most liquidity and highest traded volume over a specific period of time. Polkadot price declined below two Exponential Moving Averages (EMAs) the 10-day and 50-day represented by red and blue lines on the chart below.
The 200-day EMA is acting as support for the token at $6.15. A close below the lower trendline forming the ascending channel could confirm a trend reversal and the downside targets are the 38.2% Fibonacci retracement at $6.03 and the 50% Fibonacci retracement at $5.70.
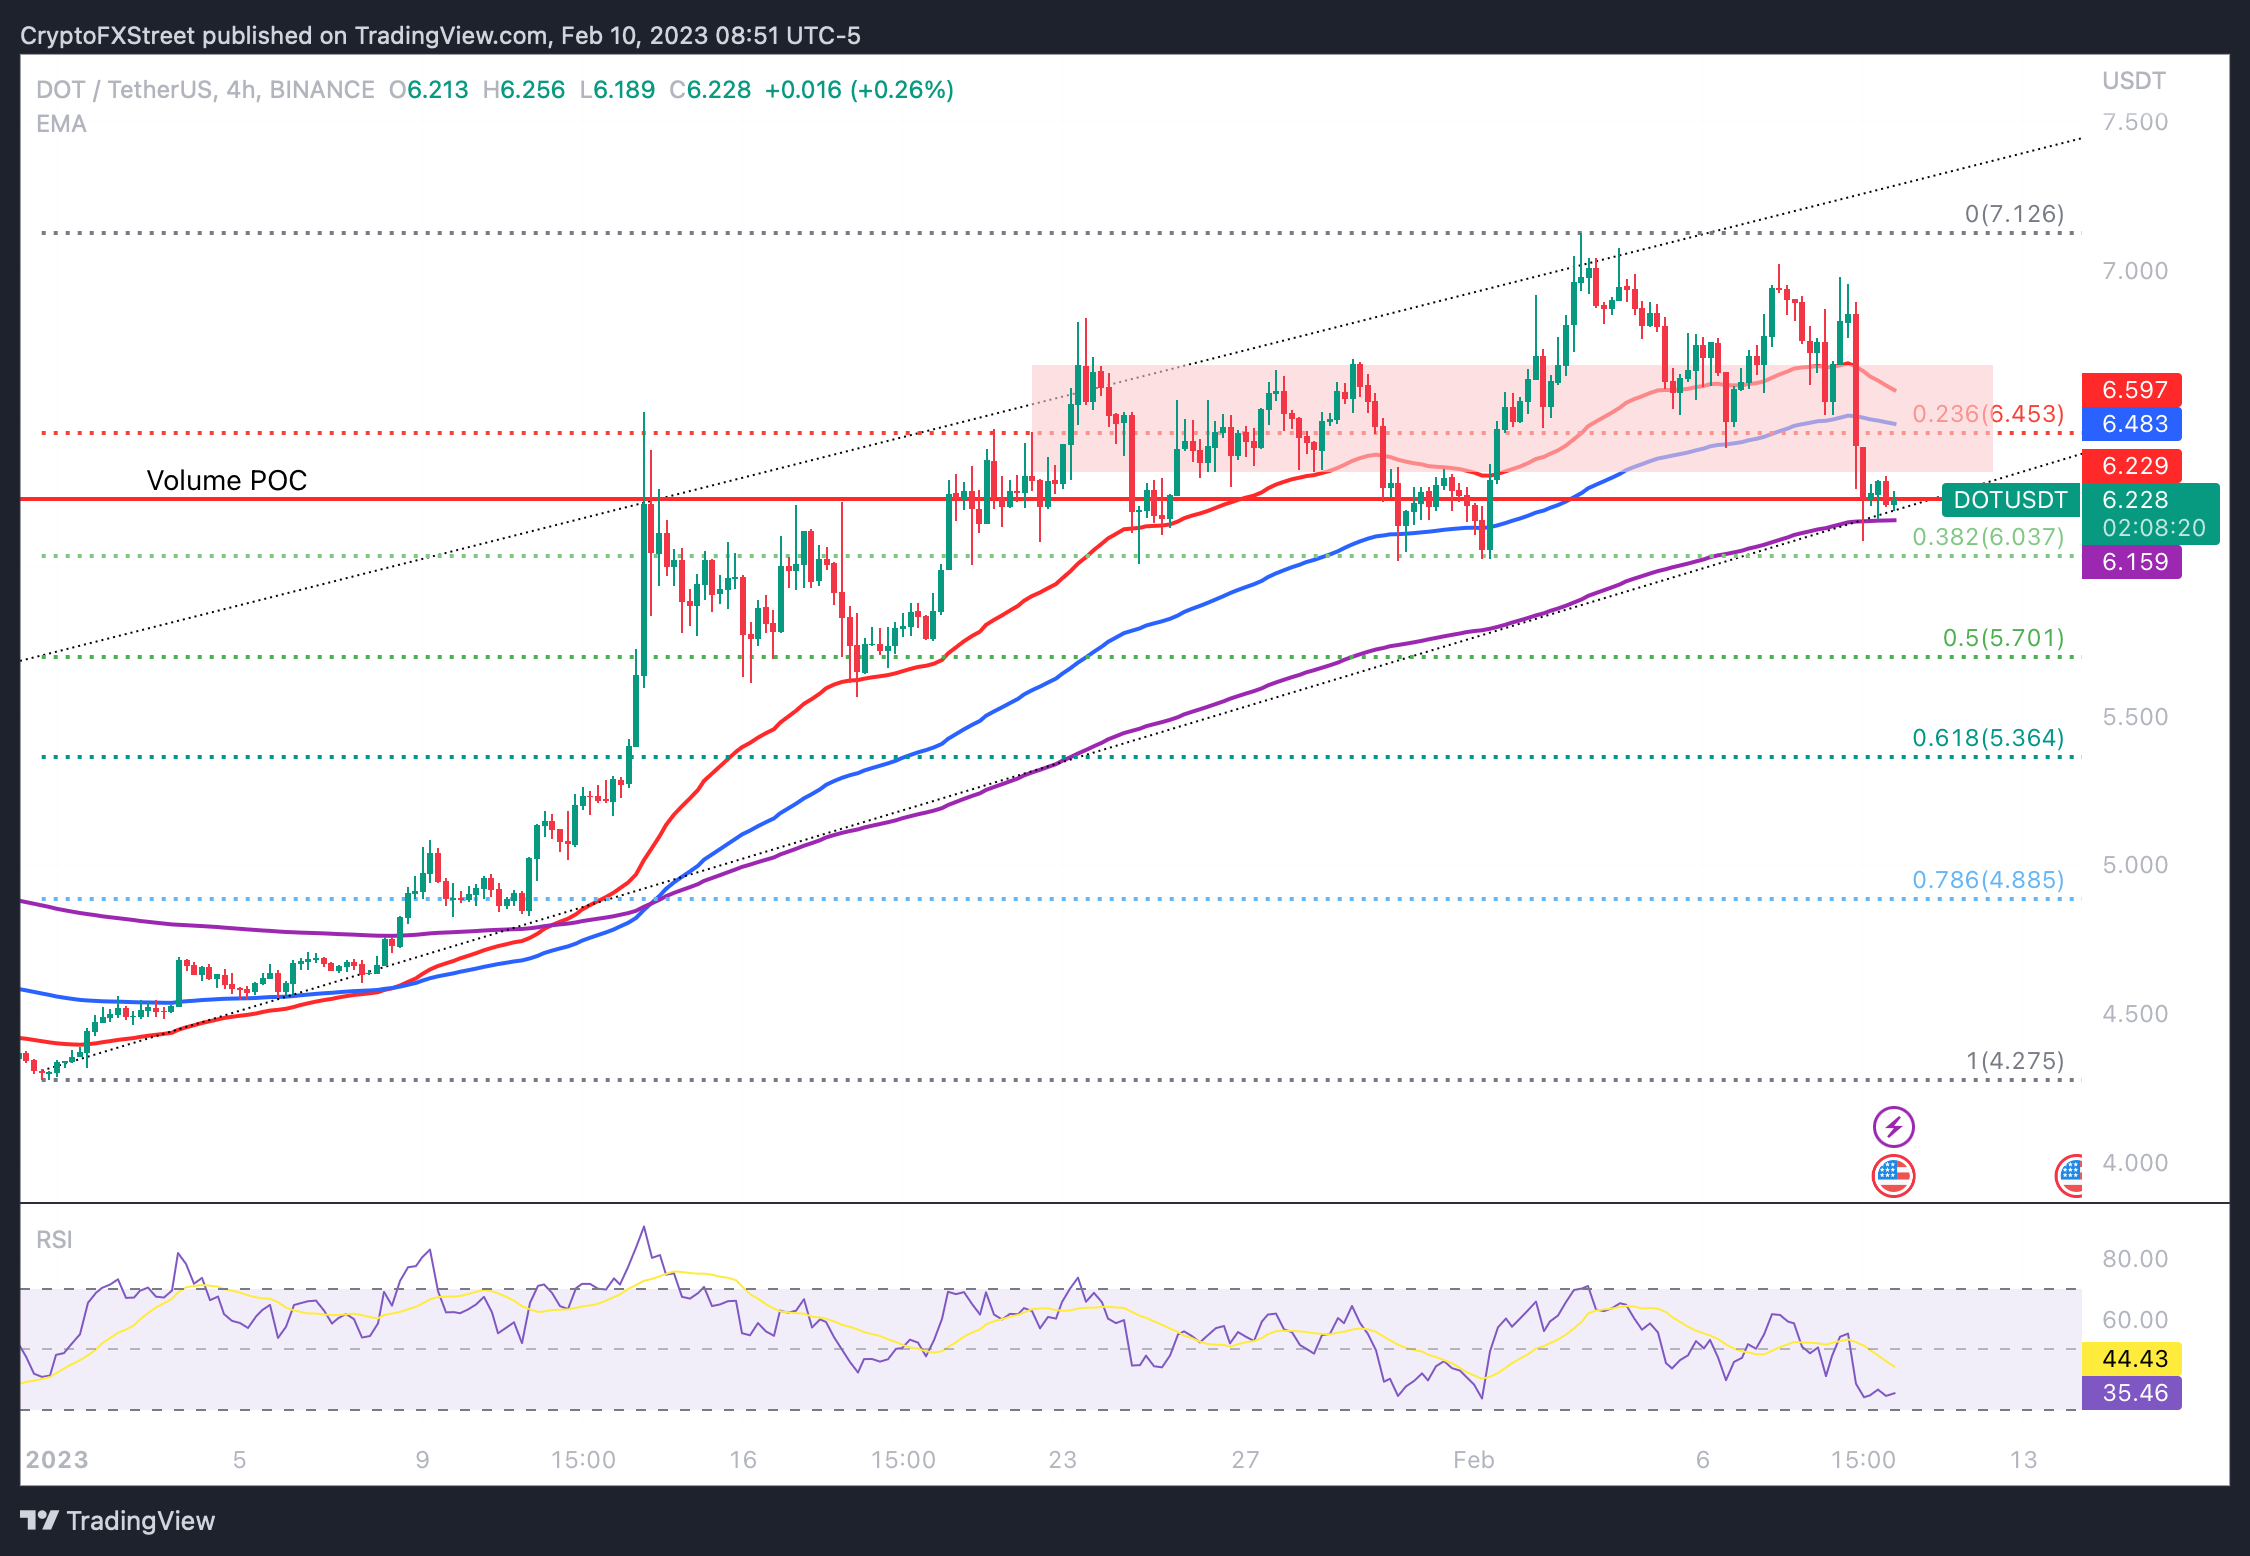
DOT/USDT price chart
There is a likelihood of a rebound from the lower trendline of the ascending channel, DOT price could enter the support zone between $6.22 and $6.59.
Relative Strength Index, a momentum indicator reads 35.46. RSI is well below the neutral level of 50 and it is important to note that the indicator reveals a bearish divergence. RSI has dropped to 35.46 for the first time since the first week of February and this has occurred only three times in 2023.
Polkadot’s short-term uptrend lacks the underlying strength and further downside correction is likely in DOT price.
Author

Ekta Mourya
FXStreet
Ekta Mourya has extensive experience in fundamental and on-chain analysis, particularly focused on impact of macroeconomics and central bank policies on cryptocurrencies.


