Polkadot bounces after sell-off, but DOT upside potential limited to $46
- Polkadot price drops as much as 15% during the Tuesday trading session.
- Over 50% of the drop has been recovered, but whether the bounce is a fake-out remains to be seen.
- Upside potential may be limited in the interim.

Polkadot price, like the rest of the cryptocurrency market, experienced a big dive lower. Despite a 10% bounce from the day’s low, Polkadot’s close is still below the daily open.
Polkadot price faces uncertain trend direction; traders digest recent sell-off
Polkadot price finds itself in a position it hasn’t been in since late September. It is currently between a combination of resistance with the Tenkan-Sen and Kijun-Sen at the $46 value area and an area of support at the top of the Ichimoku Cloud at $38.
Upside potential is likely limited to the Tenkan-Sen and Kijun-Sen. If Polkadot price does return to test those levels as resistance, traders will want to observe any breakout that would return Polkadot to a close above the Tenkan-Sen and Kijun-Sen. A bullish continuation move would likely occur of bulls rally Polkadot to a close above $48.
While Polkadot price did find responsive buying against the top of the Cloud (Senkou Span A) at $38, there remains one more primary support level thatbulls may want to test. The $35.50 value area contains two of the most potent support levels on Polkadot’s chart: the 2021 Volume Point Of Control and Senkou Span B.
The oscillators show some oversold conditions are present. The Optex Bands have an almost vertical slope and are pushing deep into the oversold range. In addition, the Composite Index is at historical support levels, and the Relative Strength Index is at the final oversold support level at 40.
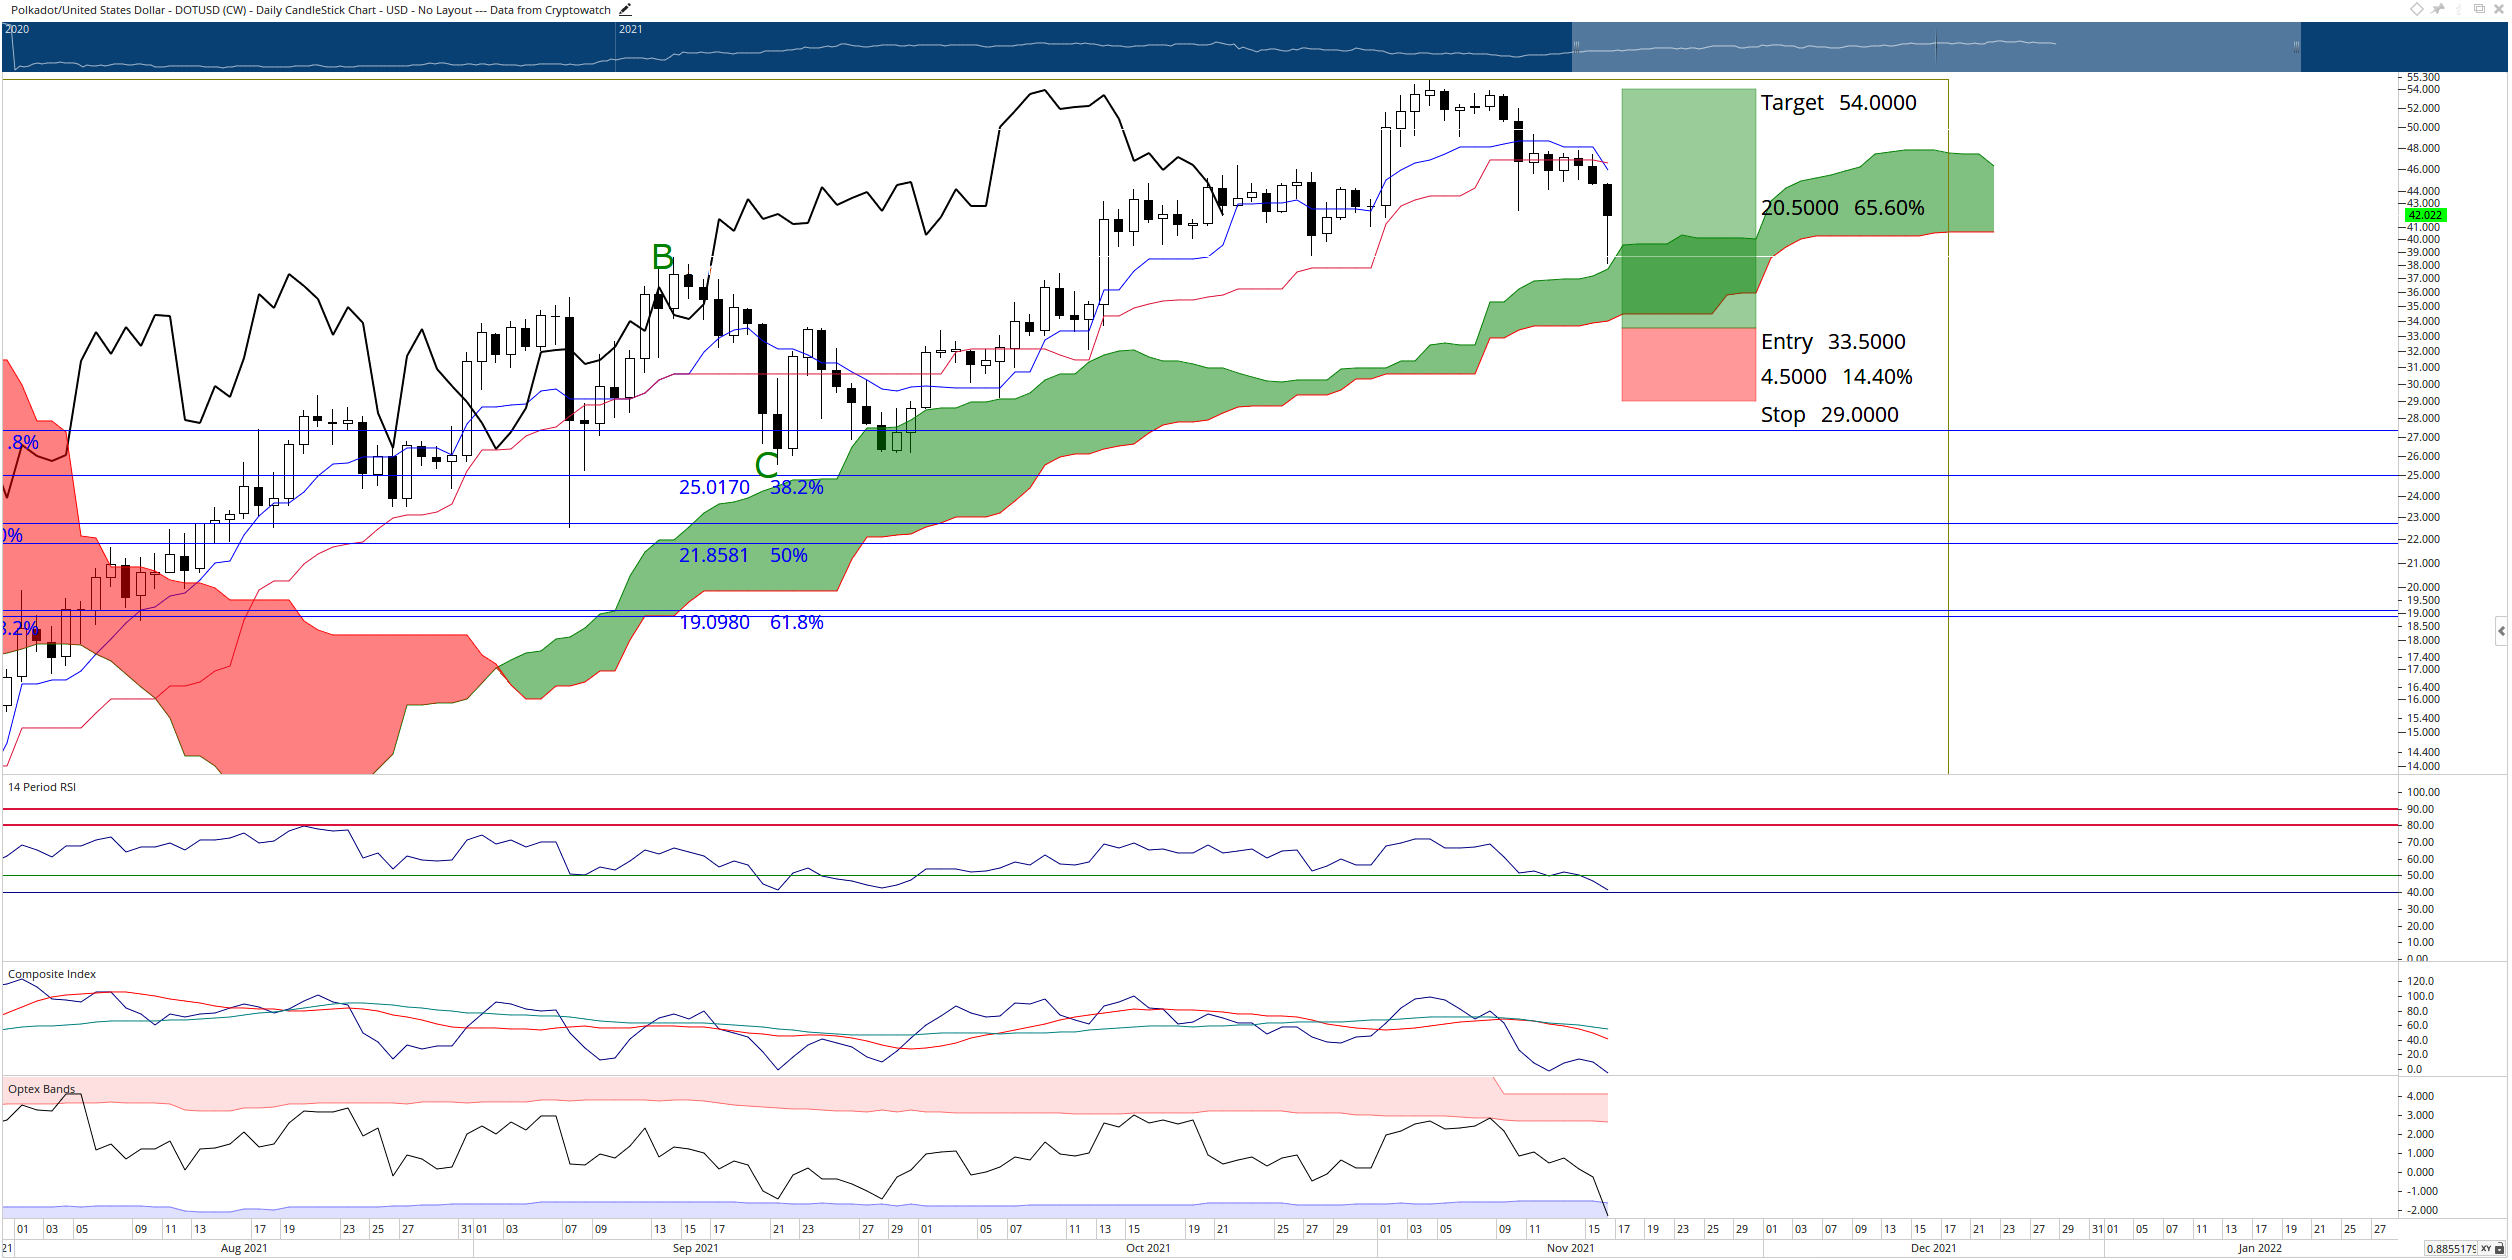
DOT/USDT Weekly Ichimoku Chart
Bulls will want to watch for any strong close at or above $48, while bears will want to watch for a close Senkou Span B at $37.
Author

Jonathan Morgan
Independent Analyst
Jonathan has been working as an Independent future, forex, and cryptocurrency trader and analyst for 8 years. He also has been writing for the past 5 years.
More from Jonathan Morgan



