Polkadot price sees positive divergence spelling bullish outlook for next week
- Polkadot is set to close the week with a clear rejection from the upside at $20.50.
- With the start of a new week, the price looks set to stay above $17.00, as the downtrend is still intact for now.
- Expect a bullish breakout as bulls keep buying the dips and are set to ramp price action up going into next week towards $37.00, a 100% gain.

Polkadot (DOT) price has been on the cusp of breaking the downtrend last week but saw a firm rejection against the green ascending trend line, converging with the 55-day Simple Moving Average at $23.40. Since then, price action has been taking through last week and this week as geopolitical tensions dominate the scene and make investors puzzled on what to do next. But the Relative Strength Index (RSI) shows signs of bulls being active at the dips and are soon to be set for a rally towards $37.00.
Seriously, who could say no to a rally that would return 100% gains
Polkadot price has been on the back foot these past two weeks as price action got two firm rejections on the top side, with first a double rejection at the green ascending trend line intersecting with the 55-day SMA. This week was no different, with rejection at $20.50, a historical level from July 26. In the process, bulls are being pushed against $17.00 and could start to look heavy going into next week.
However, looking under the hood of this price action shows us that the RSI is flatlining, although it would be logical to see it further decline as selling pressure is mounting and drilling into the price action. This is proof that for several consecutive weeks now, bulls have been buying into the price action, and going into next week, expect a bullish uptick as investors get the chance to look beyond the Ukraine situation. That would be translated into DOT price action with a price explosion back to $25.00 and continuing throughout the week towards $37.00, just below the monthly R2 resistance level.
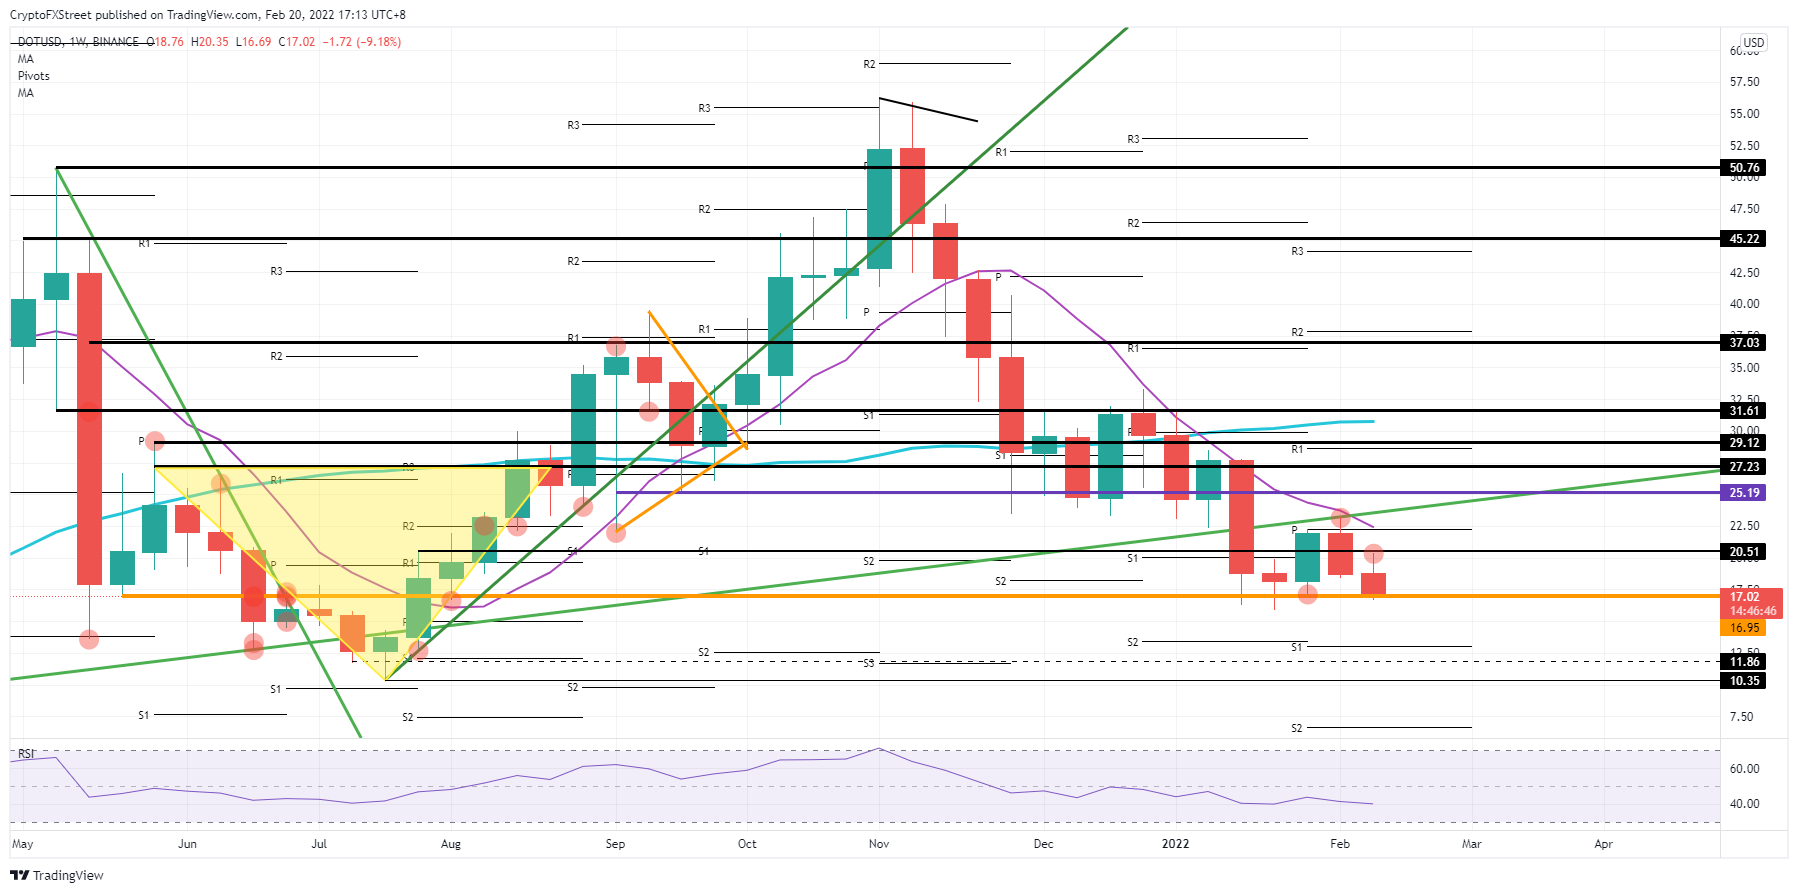
DOT/USD weekly chart
With the event risk of the Ukraine situation on the radar and cryptocurrencies being the only market open during the weekend, expect traders to be on edge to take their money and run should the situation deteriorate further with a full-size invasion. A break below $17.00 would be the initial move, and looking for support at the monthly S1 support level at $13.04. That level could be overshot by the massive number and volume of sell orders and could tick $11.86 or $10.35, the low from July 2021.
Author

Filip Lagaart
FXStreet
Filip Lagaart is a former sales/trader with over 15 years of financial markets expertise under its belt.


