PEPE price set for 16% crash after breaking below ascending trendline support
- Pepe price revisits an ascending trendline support on Wednesday.
- On-chain data shows PEPE’s negative funding fee and lower long-to-short ratio, signaling a bearish move.
- A daily candlestick close above $0.0000121 would invalidate the bearish thesis.

Pepe (PEPE) price is down 7.5% on the day at $0.0000107 as it revisits an ascending trendline support on Wednesday. On-chain data reveals a negative funding fee and a decreased long-to-short ratio for PEPE, indicating potential bearish momentum that could lead to a price decline in the coming days.
Pepe price set to crash after closing below an ascending trendline
Pepe price is down 7.5% at $0.0000107 and revisits an ascending trendline support on Wednesday. The trendline is drawn from joining multiple swing low levels between mid-April and late June, as shown in the daily chart below.
If PEPE closes below the trendline, it could crash 16% from the point of the breakout to $0.00000901. This is the 61.8% Fibonacci retracement level drawn from a swing low of $0.00000393 on April 13 to a swing high of $0.0000172 on May 27.
The Relative Strength Index (RSI) and the Awesome Oscillator (AO) on the daily chart support this bearish thesis, as both indicators are below their respective neutral levels of 50 and zero. This suggests continued momentum favoring bears, potentially leading to a further decline in the frog-theme-based meme coin.
If the overall crypto market outlook is negative, PEPE could break below $0.00000901 and extend the decline by an additional 15% to retest its May 8 low of $0.00000761.
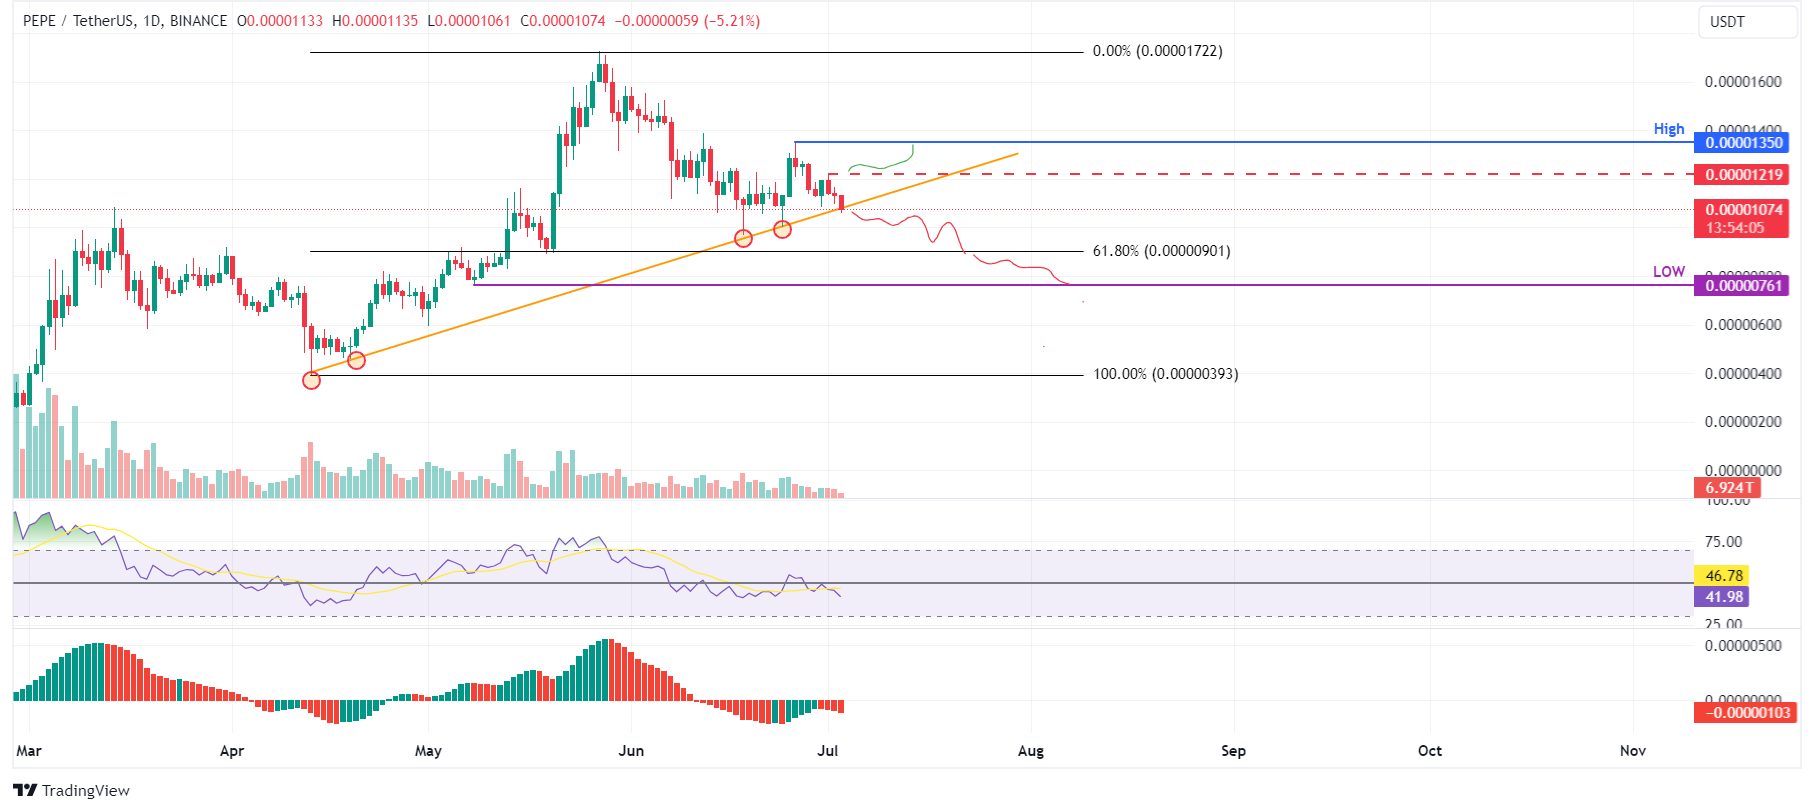
PEPE/USDT daily chart
Coinglass’s OI-Weighted Funding Rate data is a crucial metric for traders and analysts to assess market sentiment and predict future price movements. This metric relies on funding rates from futures contracts, weighted by their open interest. A positive rate (Longs pay Shorts) typically signals bullish sentiment as long positions compensate shorts. Conversely, a negative rate (Shorts pay Longs) indicates bearish sentiment, with shorts compensating longs.
In the case of PEPE, this metric reflects a negative rate, indicating that shorts are paying longs. This scenario often signifies bearish sentiment in the market, suggesting potential downward pressure on PEPE's price.
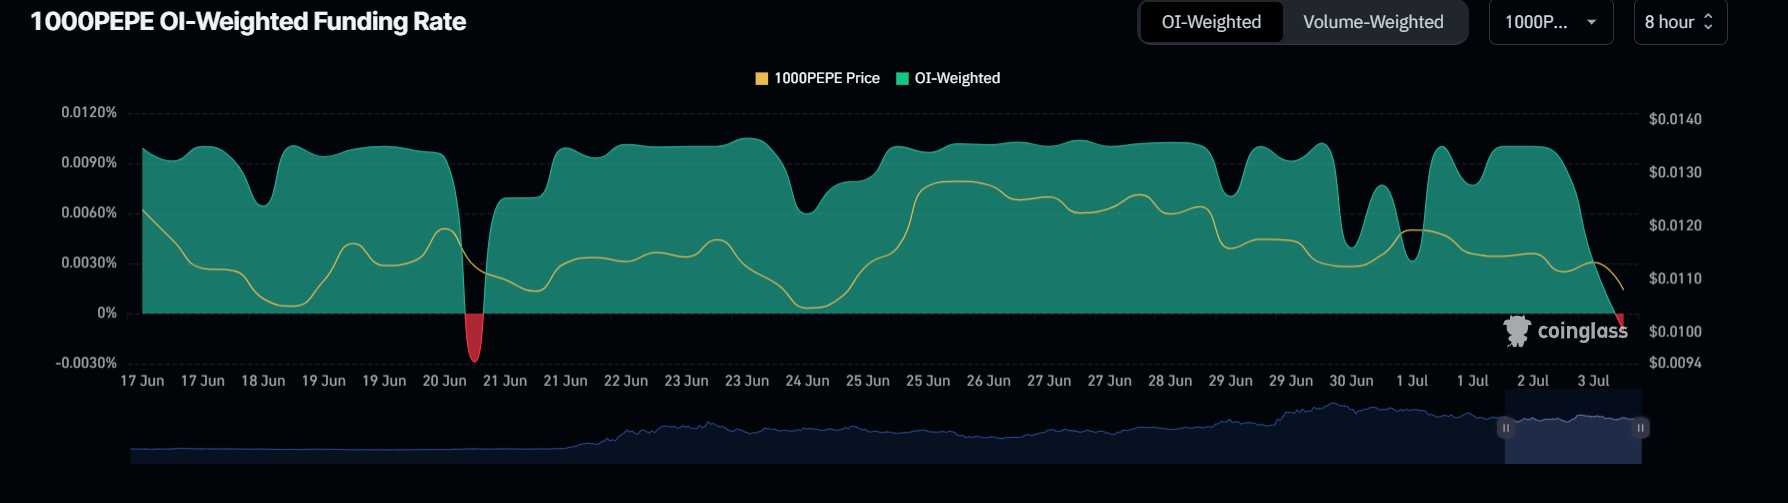
PEPE OI-Weighted Funding Rate chart
At the same time, PEPE's long-to-short ratio is 0.839. This ratio below one generally reflects bearish sentiment in the market as more traders anticipate the price of the asset to decline, further bolstering Pepe's bearish outlook.
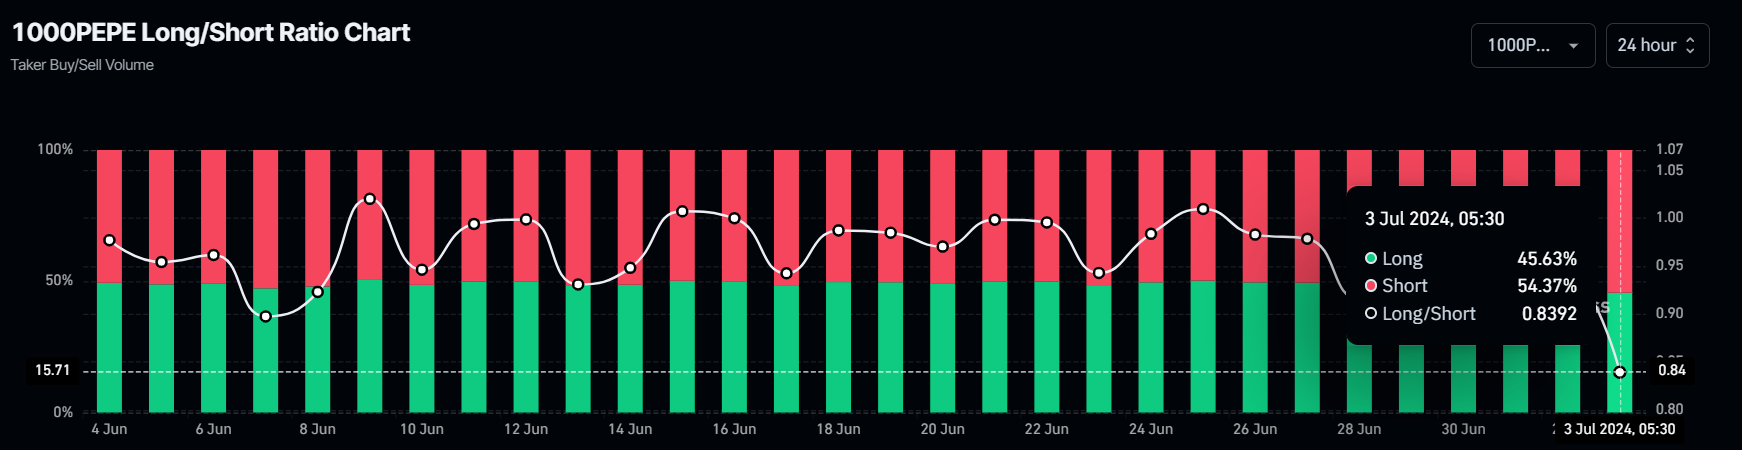
PEPE Long/Short ratio chart
However, if PEPE’s daily candlestick price closes above $0.0000121, the daily high from July 1, it would produce a higher high and signal a break in the market structure. This move would invalidate the aforementioned bearish thesis, potentially triggering an 11% rally to the previous resistance level of $0.0000135 from the daily high on June 26.
Author

Manish Chhetri
FXStreet
Manish Chhetri is a crypto specialist with over four years of experience in the cryptocurrency industry.


