Dogecoin, Shiba Inu, PEPE, BONK erase nearly 3% value as meme coin category takes a hit
- Dogecoin, Shiba Inu, Pepe, and Bonk note a correction in their price on Thursday.
- Meme coins erased nearly 6% of their market capitalization on the day, amidst a market-wide correction in crypto prices.
- Trader activity is relatively low in DOGE, SHIB, and PEPE, and nearly all top meme coins have suffered a decline in social dominance.

Meme coin market capitalization is down 6% on Thursday as the top three cryptocurrencies, Bitcoin, Ethereum, and XRP, are hit by a correction. CoinGecko data shows that the correction is market-wide.
Dogecoin (DOGE), Shiba Inu (SHIB), Pepe (PEPE), and Bonk (BONK) wipe out nearly 3% of their value on Thursday, as the correction hits the meme coin category.
Meme coin category takes a hit in crypto market correction
Meme coin market capitalization shrunk by 6% in the last 24 hours, down to $51.50 billion per CoinGecko data. DOGE, SHIB, PEPE, and BONK prices have declined on Thursday. The four meme coins offer sidelined traders a “buy the dip” opportunity.
DOGE, SHIB, and PEPE have noted a slowdown in trader activity, as active addresses declined, as seen on Santiment. Social dominance, a metric used to identify the percentage of mentions of an asset among crypto traders across social media platforms, remains low for all assets.
 [14.45.08, 25 Jul, 2024]-638575040997846861.png)
DOGE, SHIB, PEPE active addresses
Dogecoin technical analysis
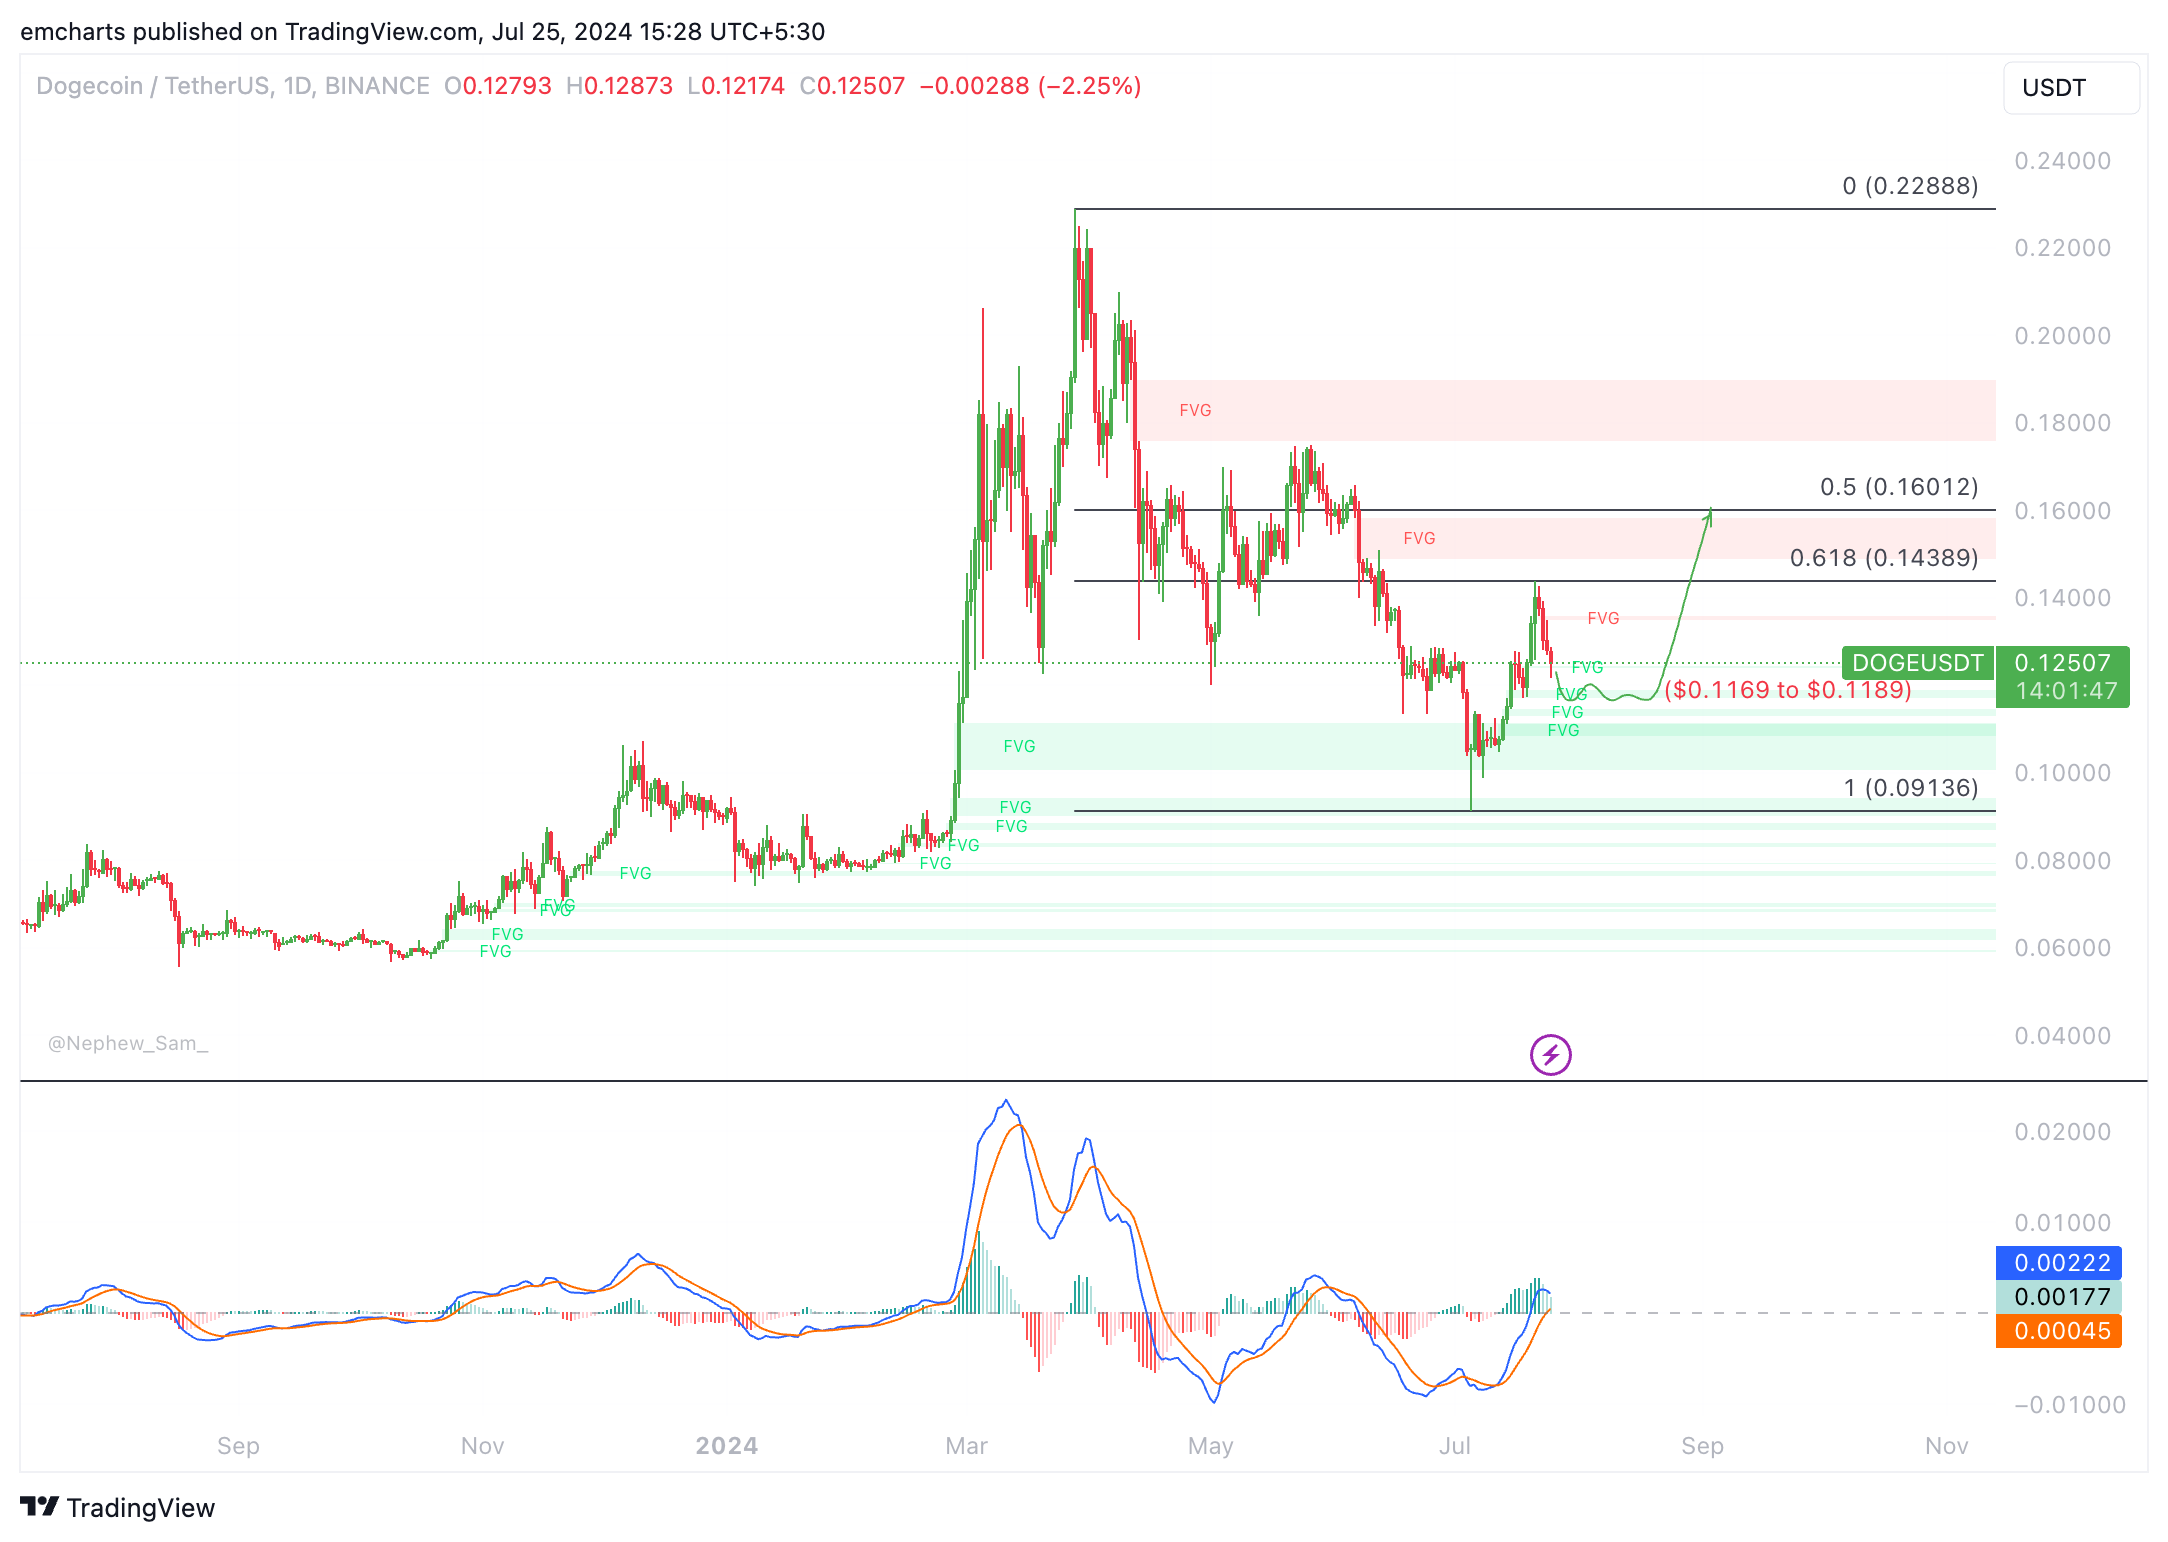
DOGE/USDT daily chart
Dogecoin’s trend reversed, and the meme coin has been forming higher highs and higher lows since July 9. The meme coin could collect liquidity at the Fair Value Gap (FVG) between $0.1169 and $0.1189 and rally towards its target at $0.1601. This level represents the 50% Fibonacci retracement of the decline between the March 28 top of $0.2288 and the July 5 low of $0.0913.
Key support levels: $0.1189, $0.1169, $0.0913
Key resistance levels: $0.1348, $0.1438, $0.1601
Shiba Inu technical analysis
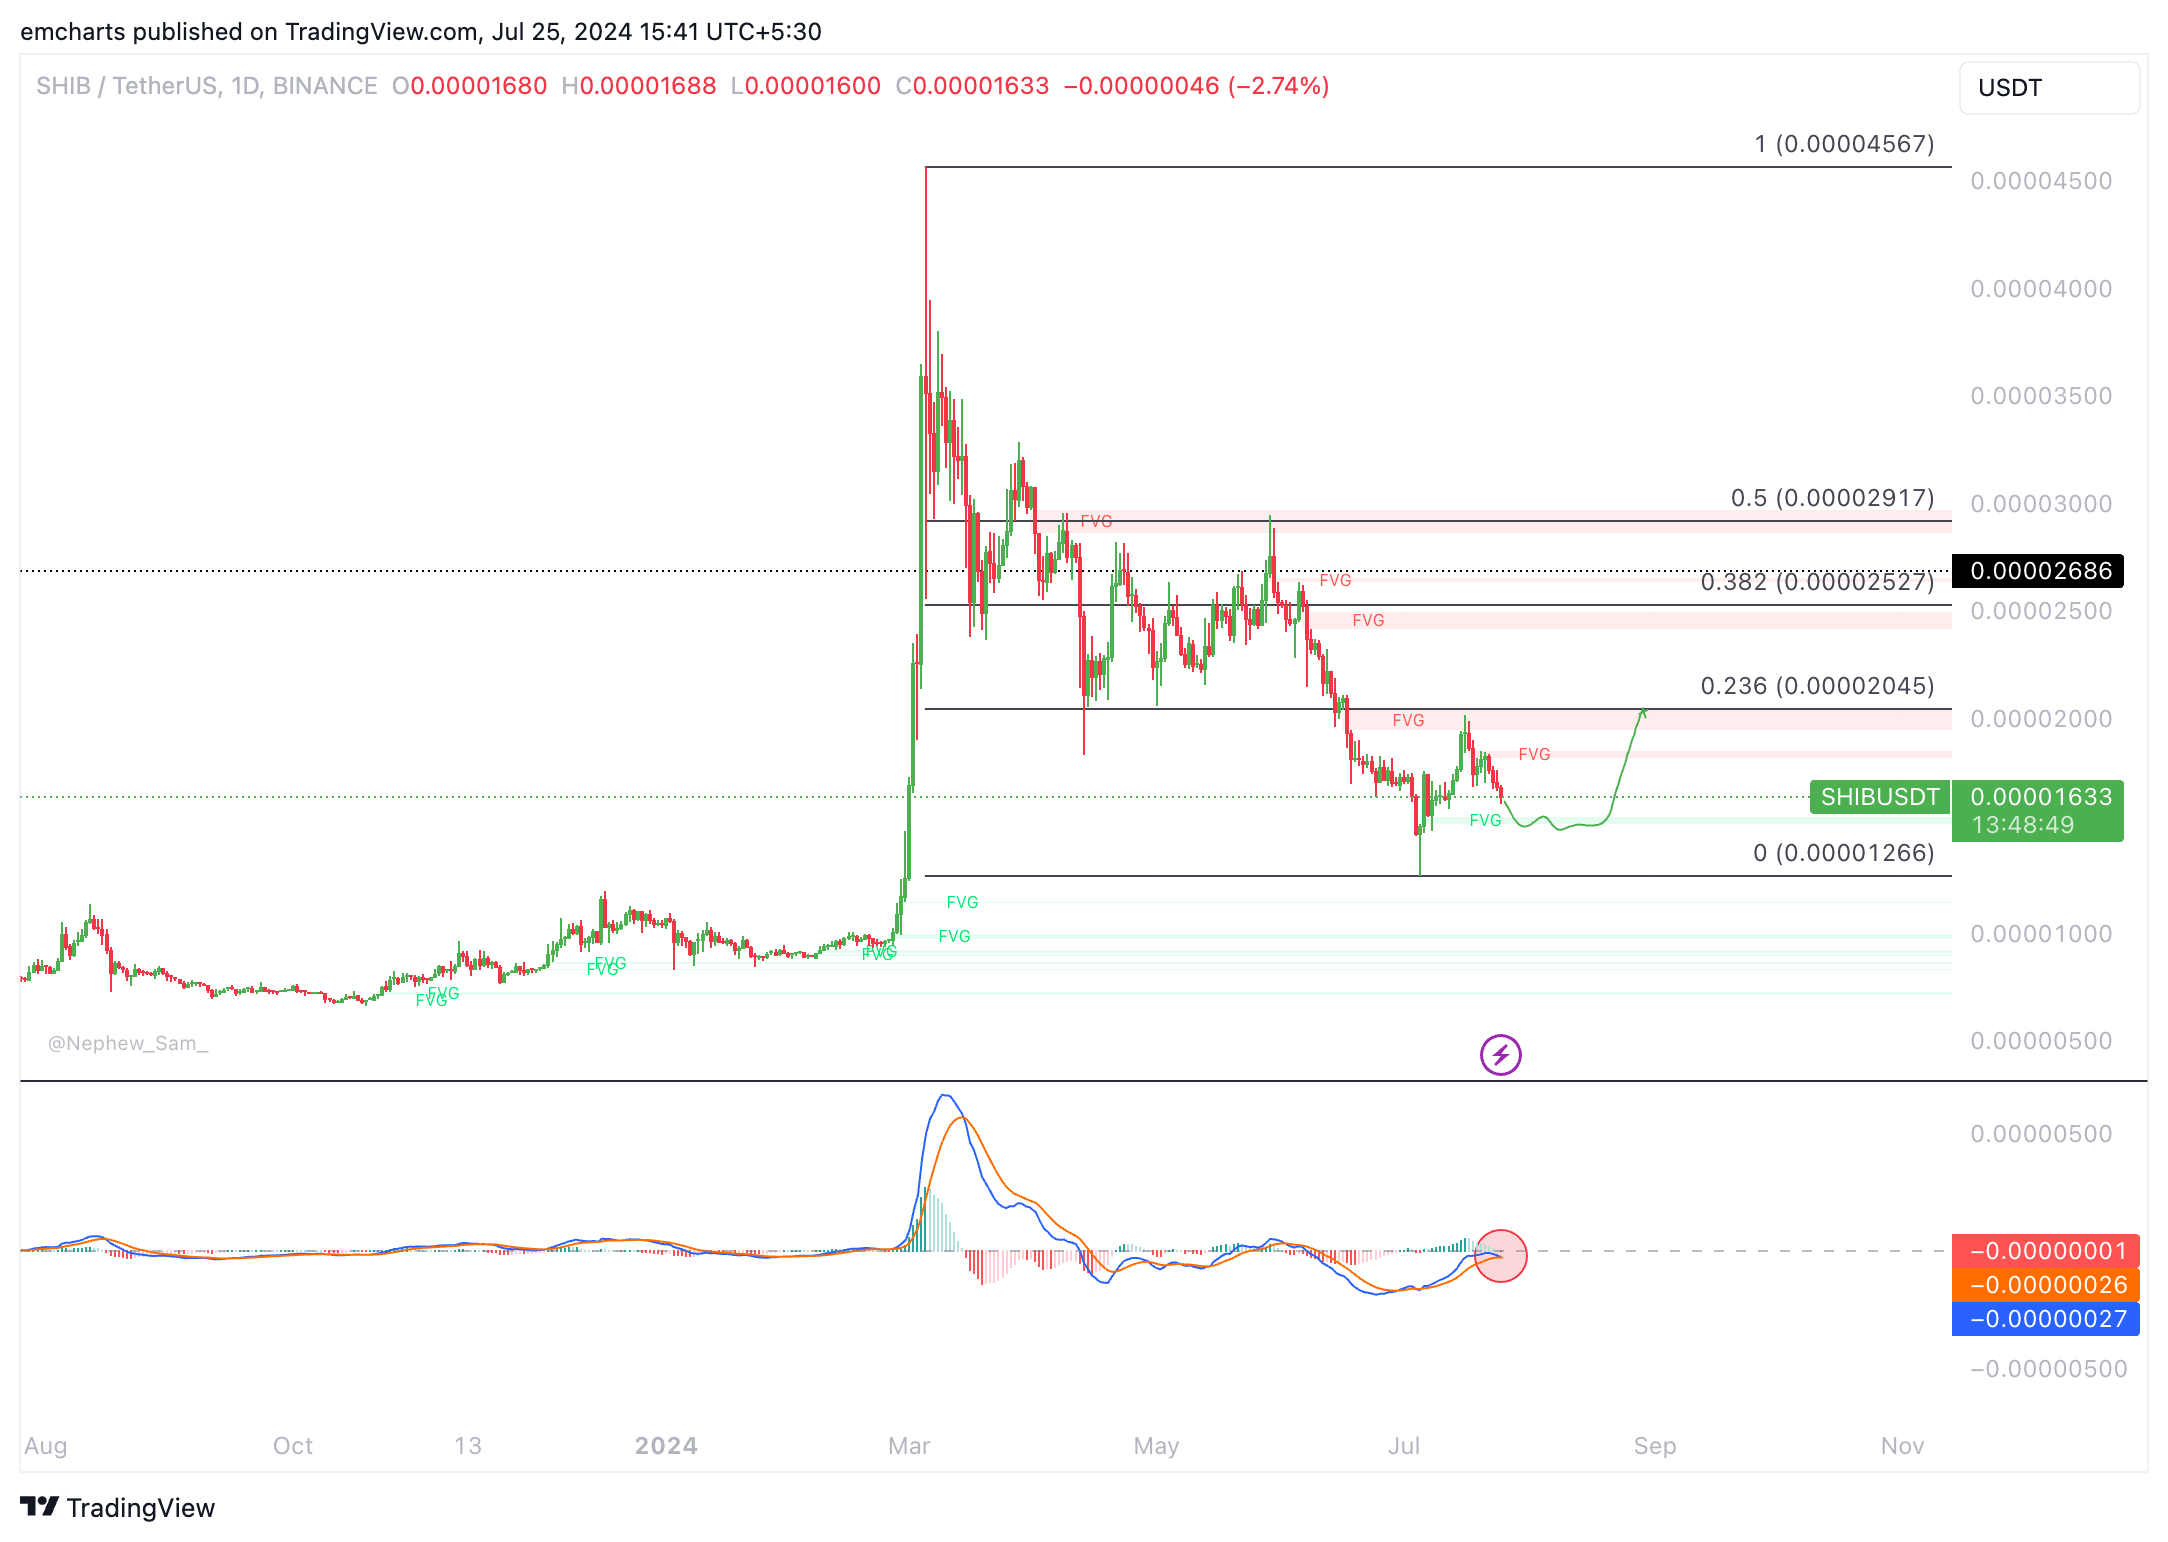
SHIB/USDT daily chart
Shiba Inu is in a downward trend. The Moving Average Convergence Divergence (MACD) momentum indicator shows negative momentum in the SHIB price trend as the signal line is crossing above the MACD line, as seen in the SHIB/USDT daily chart.
SHIB could dip into the Fair Value Gap (FVG) between $0.00001508 and $0.00001539 to collect liquidity before attempting another recovery. This marks a nearly 8% decline in SHIB price from the current level of $0.00001633.
Key support levels: $0.00001539, $0.00001508, $0.00001266
Key resistance levels: $0.00001817, $0.000020, $0.00002045
Pepe technical analysis
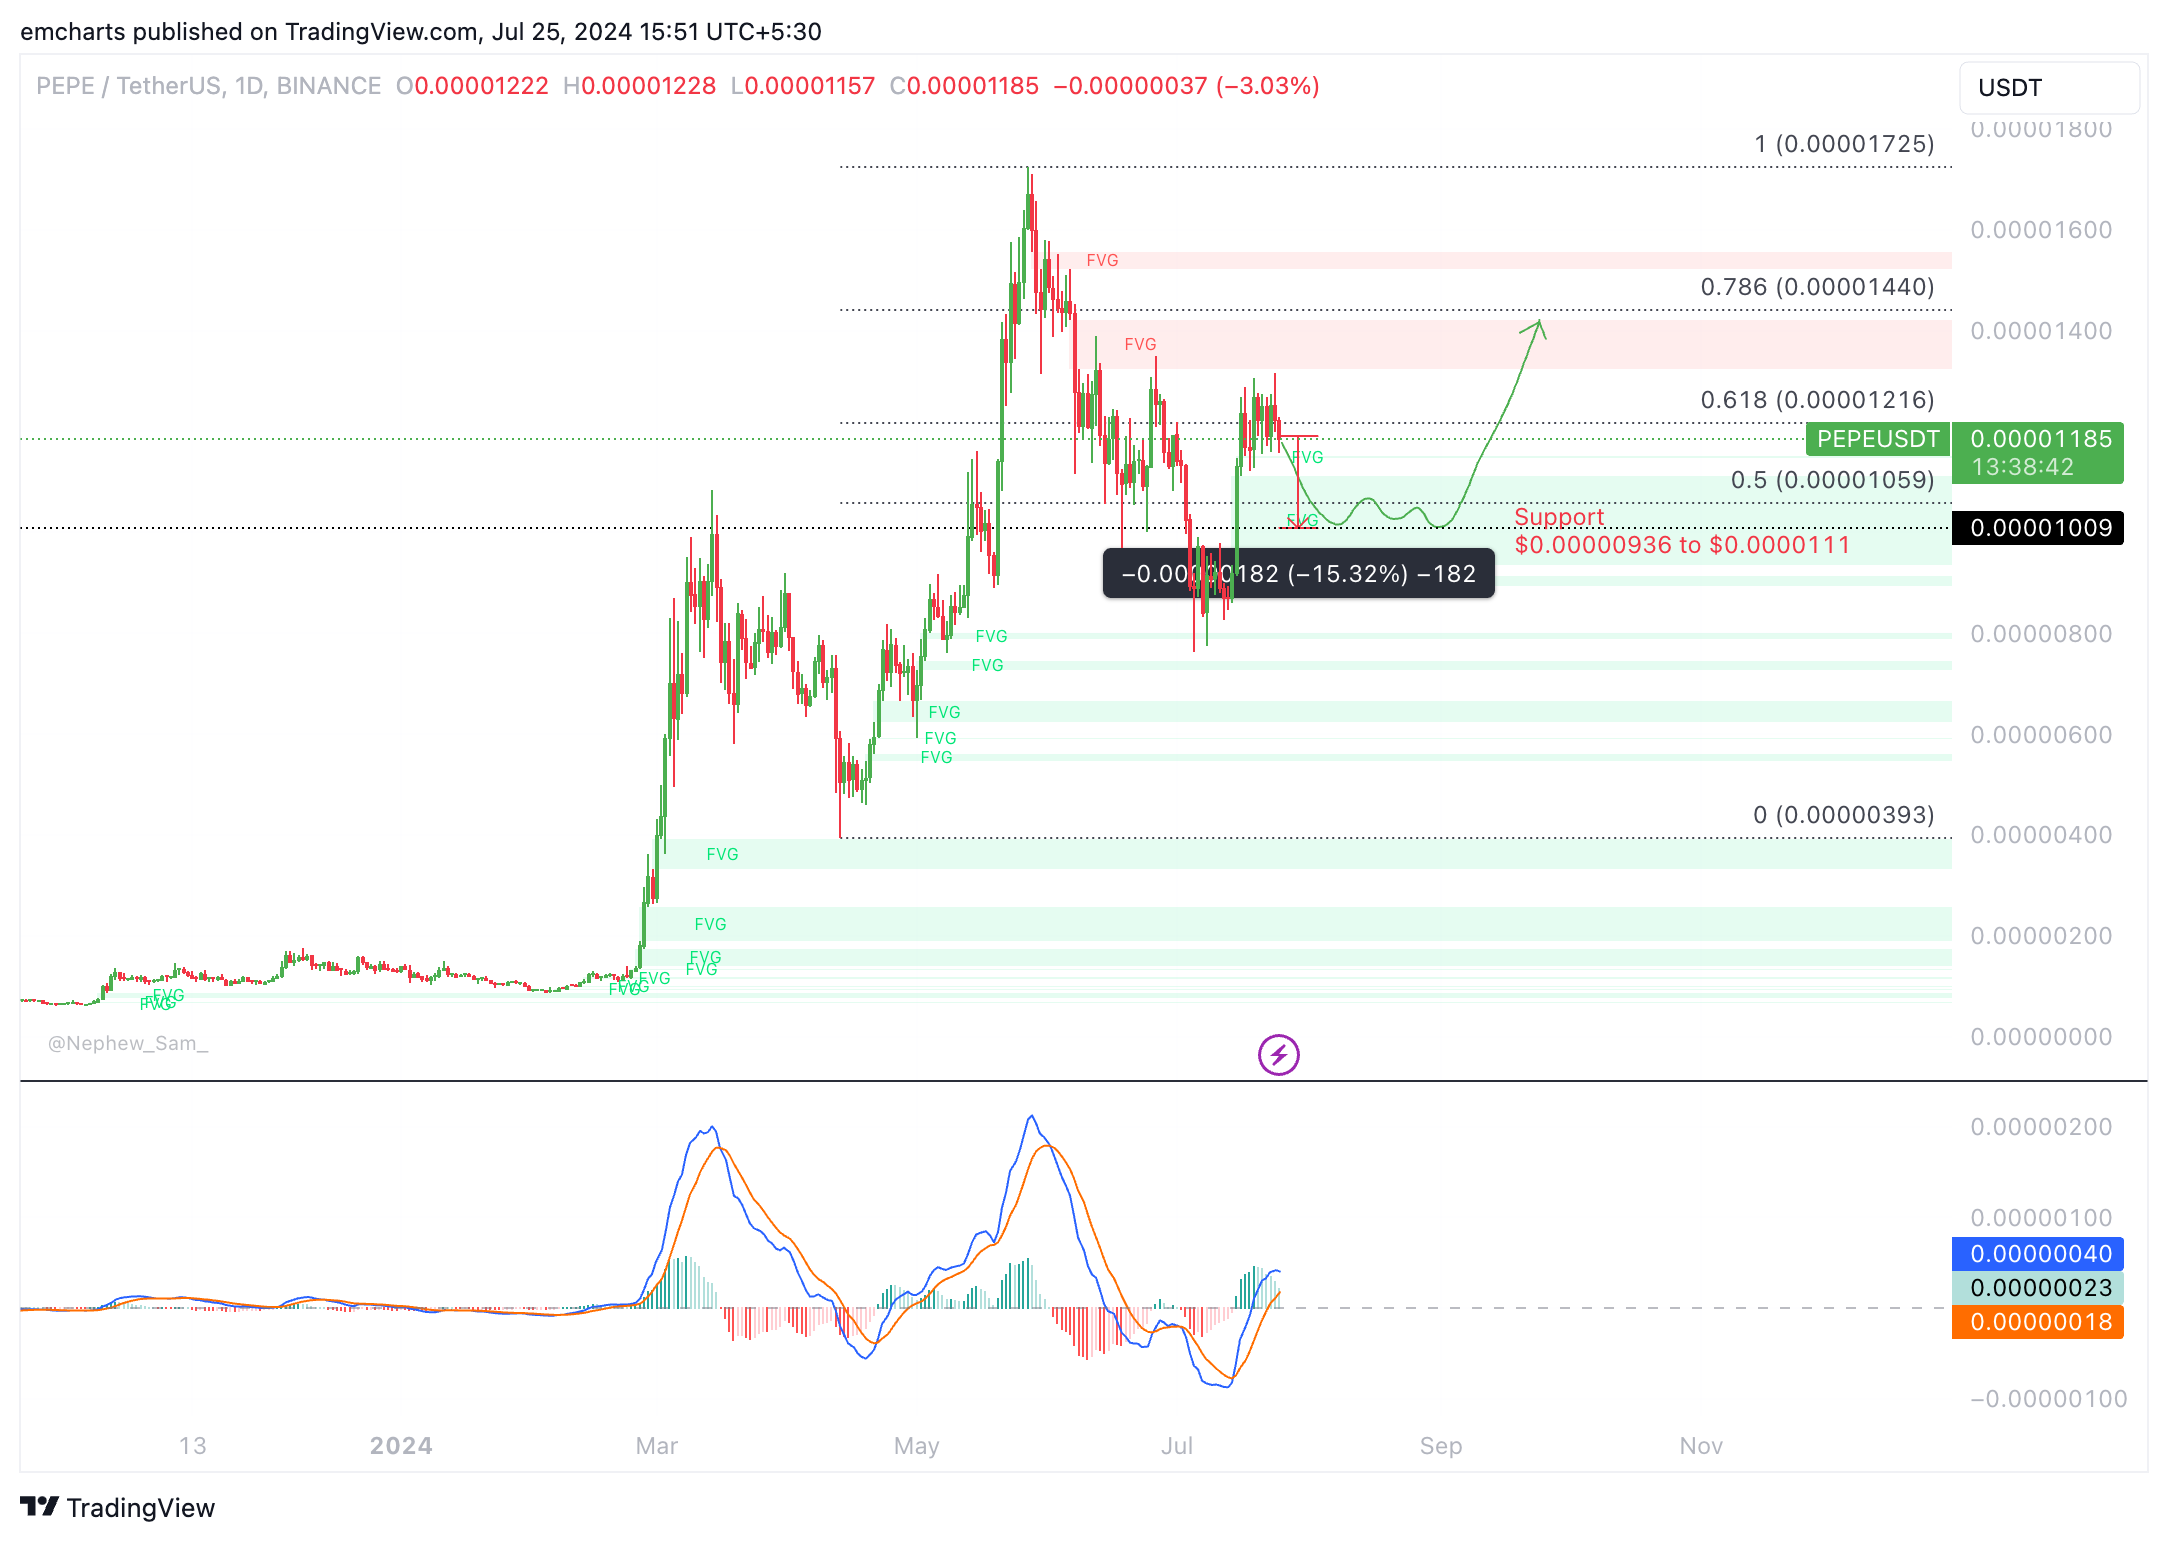
PEPE/USDT daily chart
PEPE could dip into the Fair Value Gap (FVG) between $0.00000936 and $0.0000111 to collect liquidity before advancing higher towards $0.00001440, the 78.6% Fibonacci retracement of the rally from the April 13 low of $0.00000393 to the May 27 high of $0.00001725.
Key support levels: $0.0000111, $0.00001059, $0.00000936
Key resistance levels: $0.00001216, $0.00001440
Bonk technical analysis
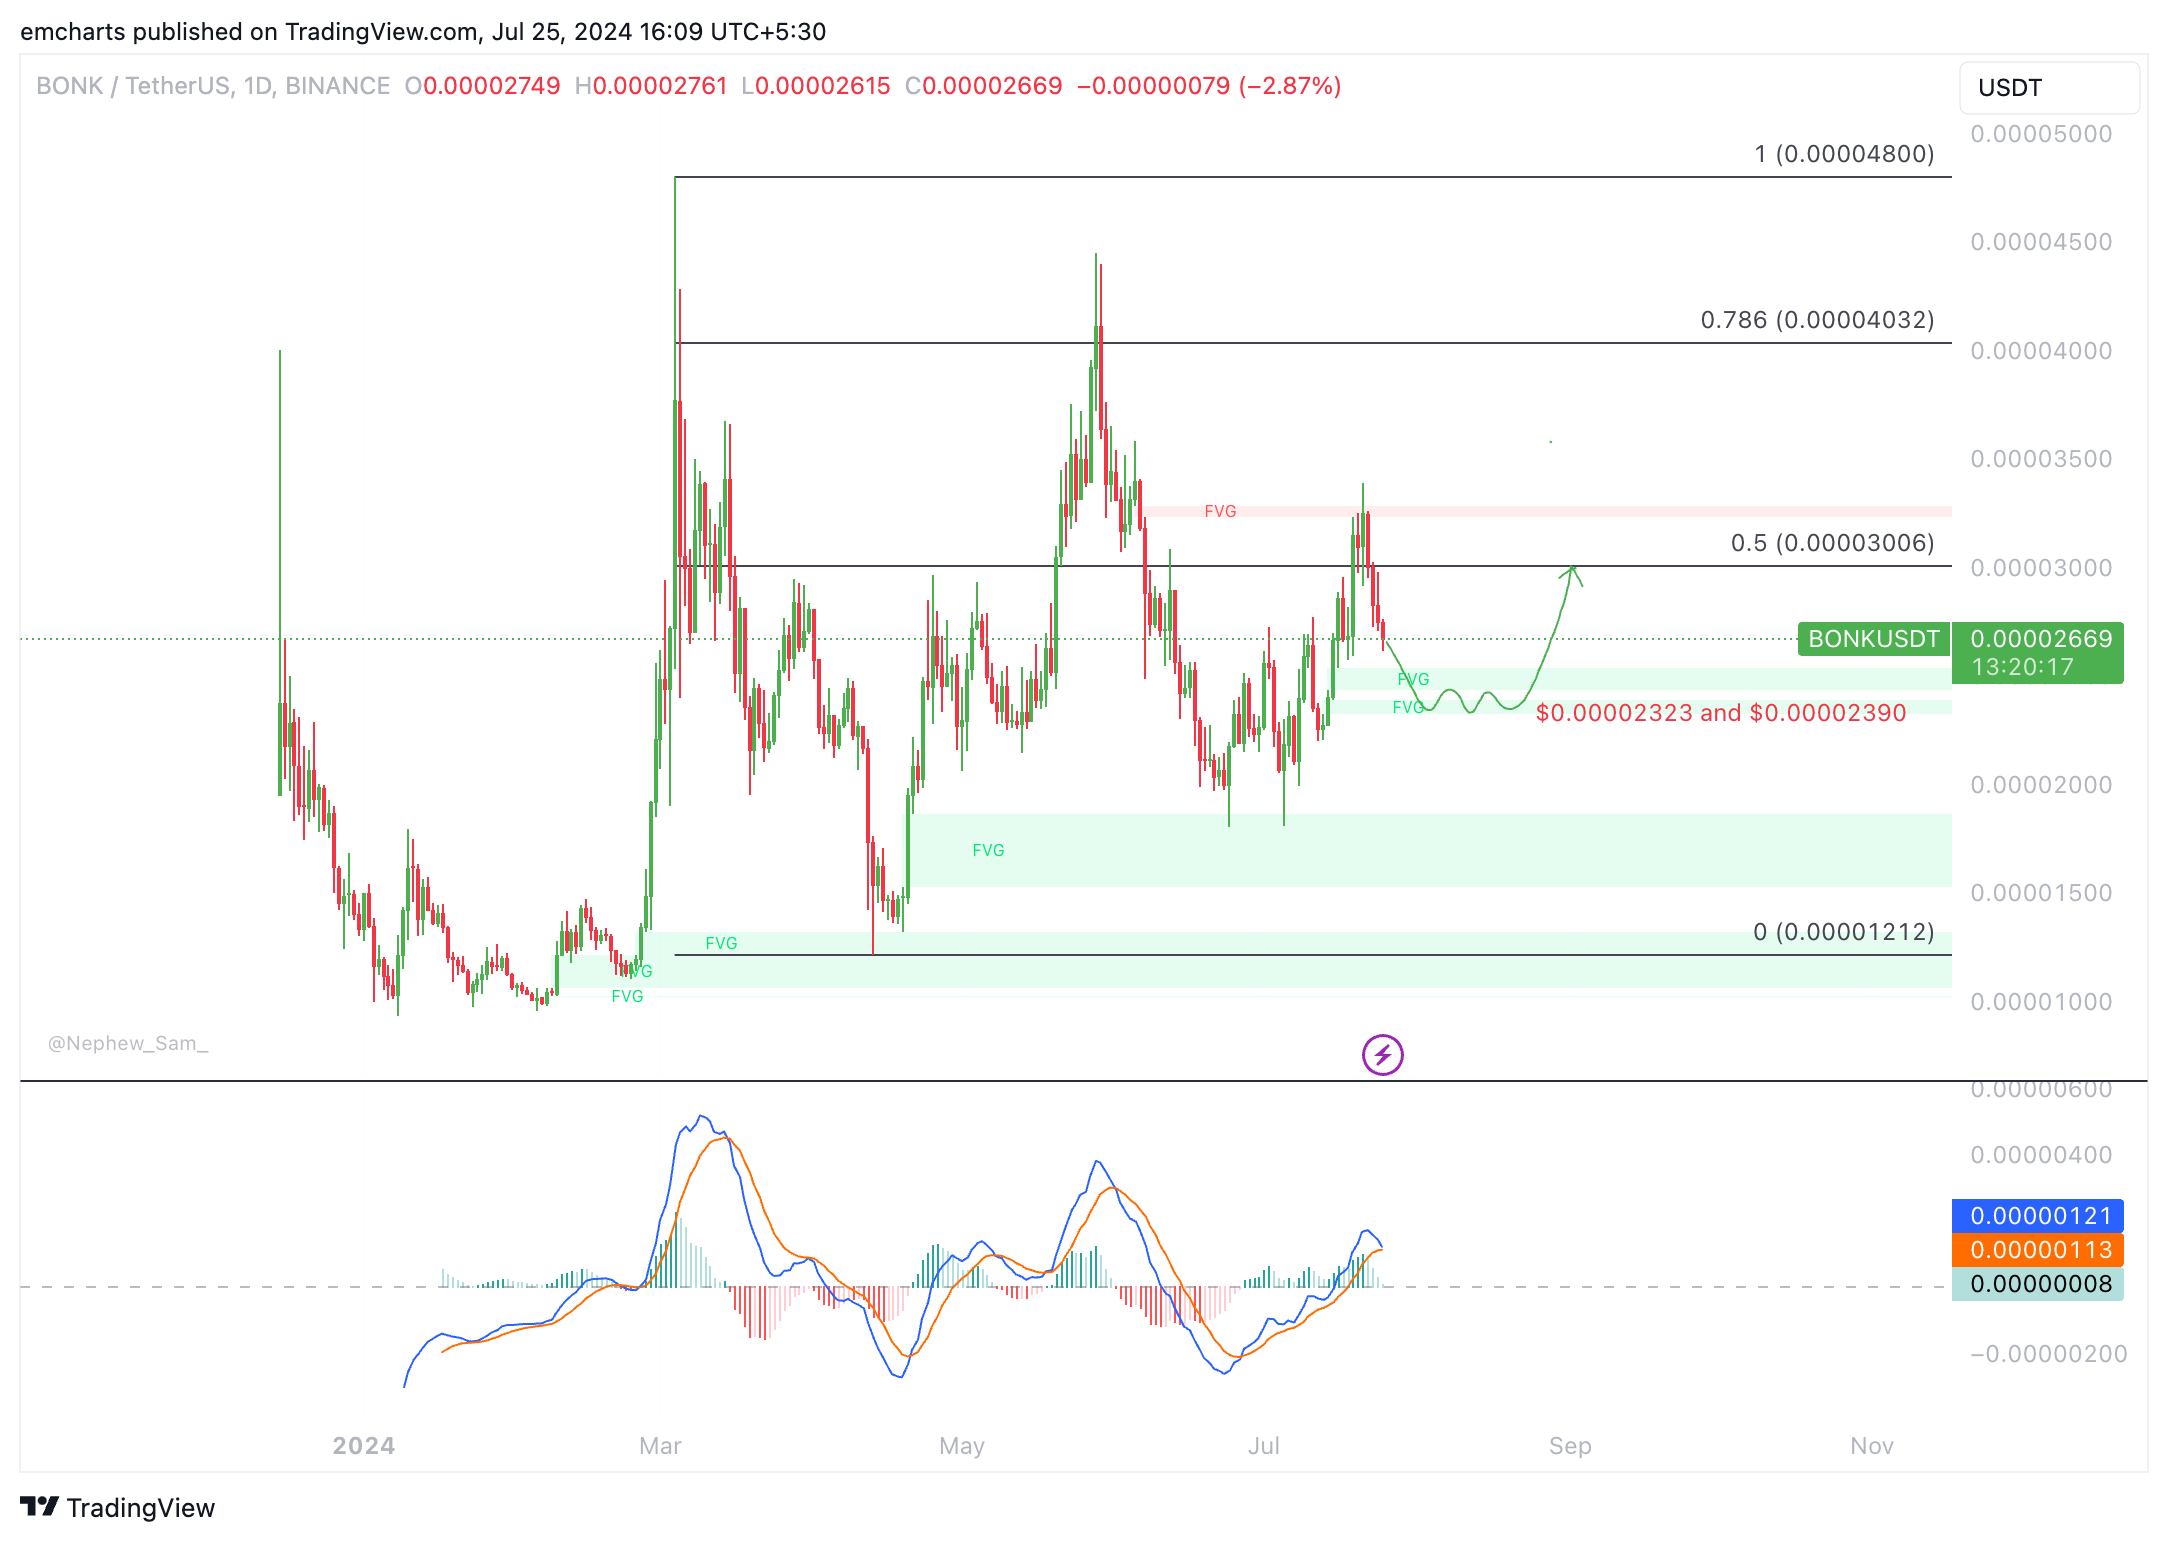
BONK/USDT daily chart
BONK could sweep liquidity between $0.00002323 and $0.00002390, the support zone or the Fair Value Gap (FVG), as seen in the chart above. BONK could fill the imbalance zone and extend gains in its uptrend that started on June 24.
Key support levels: $0.00002536, $0.00002390, $0.00002323
Key resistance levels: $0.00003006, $0.00003233
Author

Ekta Mourya
FXStreet
Ekta Mourya has extensive experience in fundamental and on-chain analysis, particularly focused on impact of macroeconomics and central bank policies on cryptocurrencies.


