Pepe Price Forecast: PEPE bears eyes for double-digit correction
- Pepe’s price extends its decline on Tuesday after correcting over 20% since Saturday.
- The technical outlook suggests further correction as momentum indicators show signs of weakness.
- On-chain data also indicates a bearish picture as PEPE’s long-to-short ratio is below one, and daily active addresses are falling.

Pepe (PEPE) continues to decline and trades below $0.000015 at the time of writing on Tuesday after correcting more than 22% since Saturday. The technical outlook suggests further correction ahead as momentum indicators show signs of weakness. Moreover, the frog theme-based meme coin’s on-chain data also indicates a bearish picture as PEPE’s long-to-short ratio is below one, and daily active addresses are falling.
Pepe shows signs of a double-digit correction
Pepe price faced rejection around a descending trendline (drawn by connecting multiple highs since early December) on Saturday and declined 22.86% until Monday, closing below its 200-day Exponential Moving Average at $0.000017. When writing on Tuesday, PEPE falls below its 61.8% Fibonacci retracement level at $0.000015 (calculated from an early November low of $0.0000077 to an early December high of $0.000028).
If PEPE continues to pull back and closes below $0.000015 on a daily basis, it could extend the decline by 14% from current levels and retest its daily support level at $0.000013.
The Relative Strength Index (RSI) on the daily chart reads 38, below its neutral level of 50 and points downwards, indicating strong bearish momentum. The Moving Average Convergence Divergence (MACD) indicator also shows a bearish crossover on Sunday, suggesting a sell signal and a downtrend.
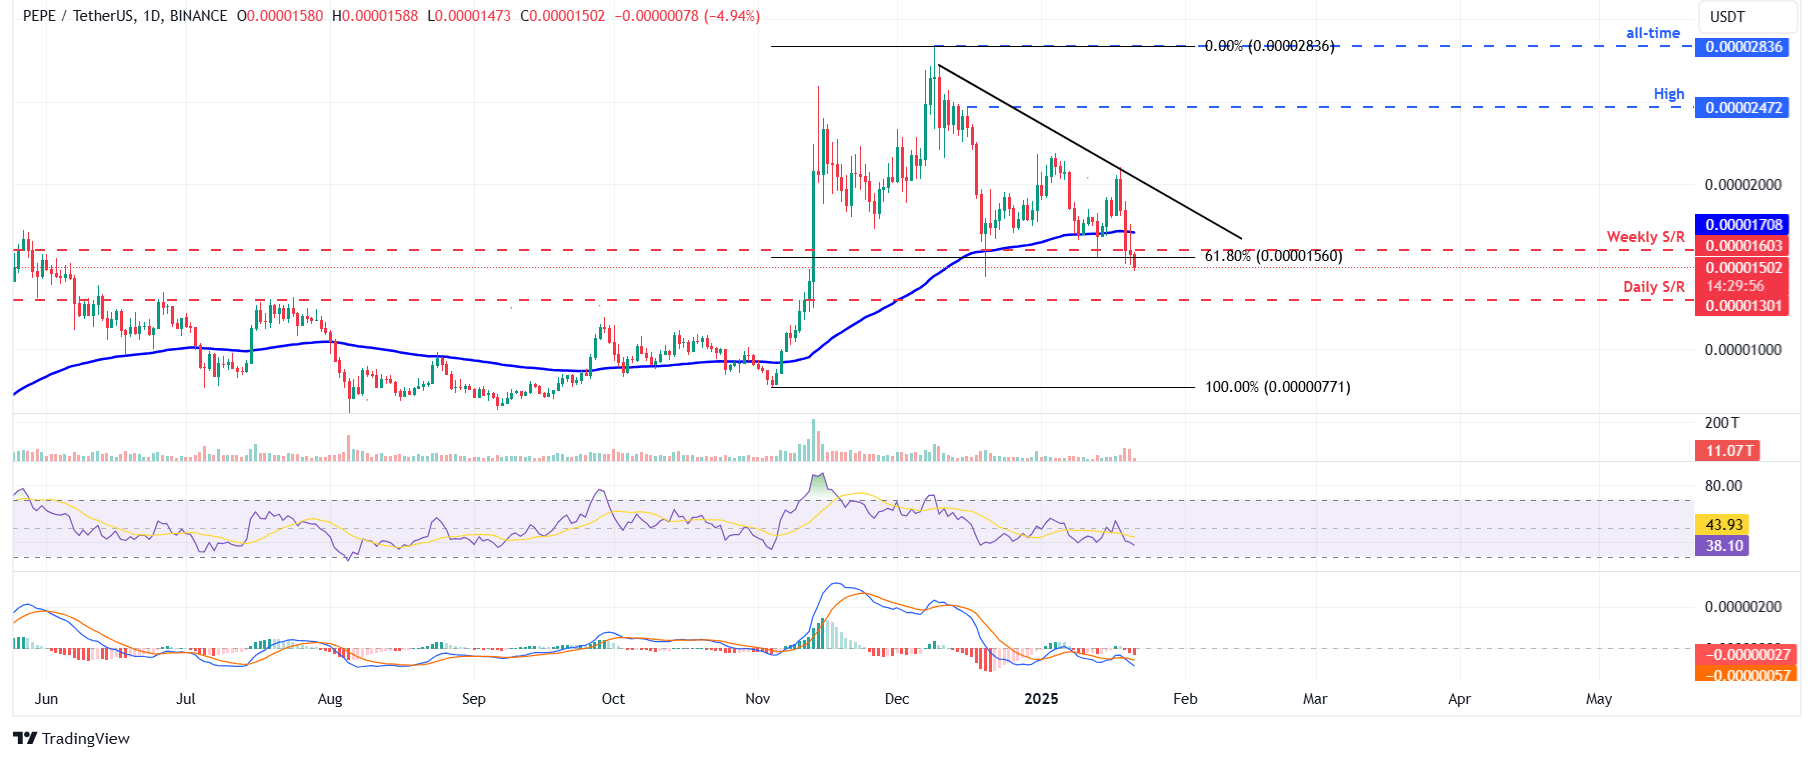
PEPE/USDT daily chart
Another bearish sign is Coinglass’s Pepe long-to-short ratio, which reads 0.80, the lowest level in over a month. This ratio below one reflects bearish sentiment in the markets as more traders are betting for the Pepe price to fall.
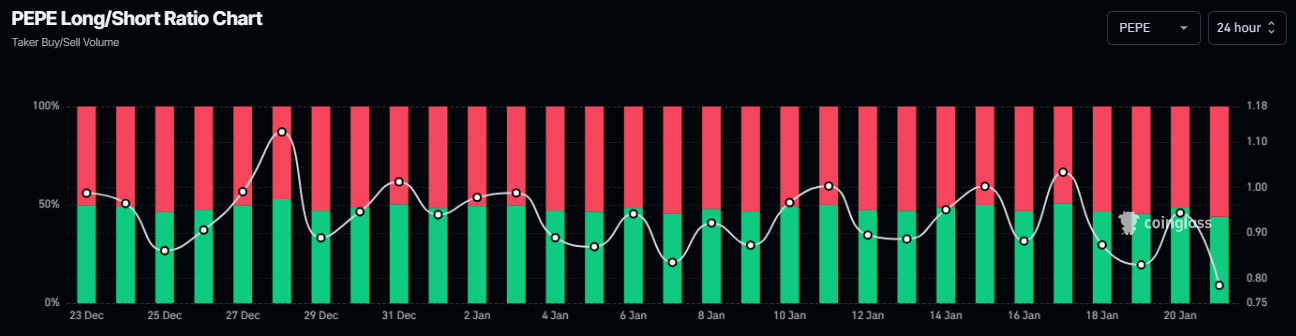
Pepe long-to-short ratio chart. Source: Coinglass
Santiment’s Daily Active Addresses index, which tracks network activity over time, paints a bearish picture for the frog-theme-based meme coin. A rise in the metric signals greater blockchain usage, while declining addresses point to lower demand for the network.
In PEPE’s case, Daily Active Addresses fell from 28,131 in mid-November to 2,606 last week. This indicates that demand for Pepe’s blockchain usage is decreasing, which doesn’t bode well for Pepe’s price.
%20[15.03.05,%2021%20Jan,%202025]-638730565976346627.png)
Pepe Active Addresses chart. Source: Santiment
Author

Manish Chhetri
FXStreet
Manish Chhetri is a crypto specialist with over four years of experience in the cryptocurrency industry.


