PEPE could decline further as long-term holders continue to shed holdings
- Two PEPE whales have potentially sold nearly 1 trillion PEPE in the past 24 hours.
- On-chain data shows PEPE long-term holders, taking profits since March, are more sensitive to price dips.
- PEPE could experience a massive correction following the formation of a daily head-and-shoulders pattern.

PEPE is down nearly 2% on Wednesday following key insights that long-term holders have been consistently booking profits since March. The move appears to be creating a head-and-shoulder pattern on the daily chart for PEPE, which can trigger a heavy correction.
PEPE’s on-chain metrics and price action indicate potential decline
Some PEPE whales have been dumping their holdings in the past 24 hours, according to Lookonchain's data. A whale who spent $3.13 million to buy 420B PEPE during the market crash on August 5 and August 12 potentially sold all of its holdings for a profit of only $30K.
Following the move, another whale who spent $8.34 million to accumulate 750.38B PEPE transferred 500B PEPE worth $4 million to the Kraken exchange, potentially realizing a loss of $2.3 million. The whale still holds 250.33B PEPE worth $2.02 million at the time of writing.
The recent dump may not be peculiar to these whales alone as the exchange inflows of PEPE saw a spike above 1.44 trillion PEPE tokens as of 12:00 GMT on Wednesday, according to Santiment's data.
PEPE holders have potentially been shedding their holdings whenever the meme coin sees a spike or a dip. The 365-day Dormant Circulation, which tracks coins that were last moved in the past year, has seen spikes, especially when PEPE attempts to dip after recording a new high.
 [21.39.12, 14 Aug, 2024]-638592704169864176.png)
PEPE Dormant Circulation (180day & 365day)
This suggests that this cohort may now be more sensitive to price dips than a rally, especially after the 180-day holders shed a portion of their holdings during the market rally in March before graduating to the 365-day Dormant Circulation category.
Such behavior suggests that holders of old coins have feeble hands and may dump during key price movements.
The 180-day to 365-day Realized Cap HODL Waves suggest PEPE long-term holders (LTH) may have been consistently taking profits since March. A decline in this metric suggests old coins are being spent or sold, and vice versa when the metric Increases. As the chart below reveals, PEPE LTHs have consistently shed their holdings.
 [21.34.23, 14 Aug, 2024]-638592704688761432.png)
PEPE Realized Cap HODL Waves (180d to 365d)
On the technical side, PEPE seems to be forming a head and shoulder pattern on the daily chart. If PEPE breaches the neckline around $0.00000760 and falls further below the left shoulder's low at $0.00000570, it could face a massive correction.
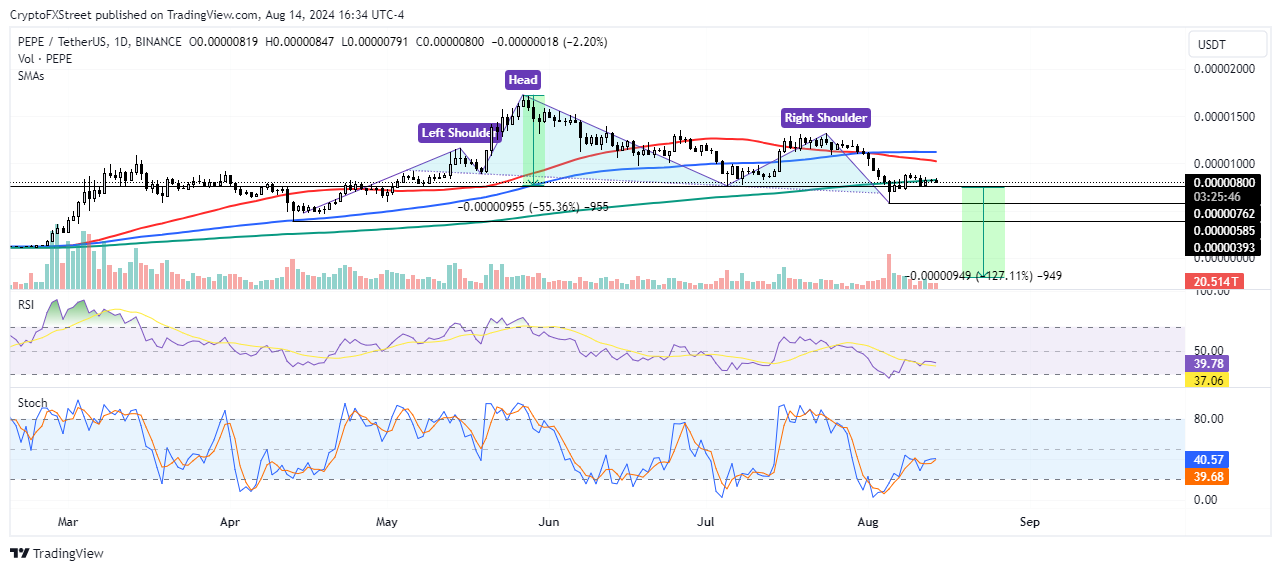
PEPE/USDT Daily chart
A daily candlestick close above $0.00001405 will invalidate the bearish thesis.
Additionally, this analysis is subject to Bitcoin's price movement as top meme coins often mimic its price.
Author

Michael Ebiekutan
FXStreet
With a deep passion for web3 technology, he's collaborated with industry-leading brands like Mara, ITAK, and FXStreet in delivering groundbreaking reports on web3's transformative potential across diverse sectors. In addition to


