Optimism’s OP token flashes all the necessary buy signals before it triggers a massive rally
- Optimism price has shown incredible resilience even as many altcoins slide lower.
- The big picture of OP shows that it has been on a bull trend since its launch in May 2022.
- As the Layer 2 token bounces off the ascending parallel channel’s lower limit, investors can do nothing but accumulate the altcoin.
- Market participants can expect OP price to kickstart a rally that could extend anywhere from 20% to 70%.

Optimism (OP) price has been on a multi-month uptrend on a higher time frame. After its recent encounter with a support floor, the Layer 2 (L2) token has kickstarted its ascent and rallied 63% in under two months.
Read more: Why Optimism (OP) and other Layer 2 tokens will rally after EIP-4844
Optimism price ready to shoot higher
Optimism (OP) price has produced six distinctive higher lows and three higher highs since its inception in May 2023. Connecting the swing highs and swing lows using trendlines reveals an ascending parallel channel in play. The 67% downswing from its all-time high of $3.29 found support on the parallel channel’s lower trendline.
The bounce from this trendline has propelled the Optimism (OP) price by 63% to where it currently trades at $1.72. In doing so, the Layer 2 token’s indicators have all flashed buy signals. The earliest sign for bulls was the Wave Trend indicator, which triggered a bullish crossover. More recently, the Relative Strength Index (RSI) has bounced off the mean level at 50, signaling a resurgence of bulls. Lastly, the Awesome Oscillator (AO) histograms have flipped above the zero line, suggesting what RSI has – a return of bullish momentum.
The aforementioned 63% upswing has caused OP to flip the $1.36 hurdle into a support level. As buyers continue to buy dips on lower time frames with bullish higher time frame indicators, the Layer 2 token is bound to encounter the $2.07 hurdle.
Investors should expect Optimism (OP) price to consolidate between the $2.07 and $2.85 hurdles since it also coincides with the parallel channel’s midpoint.
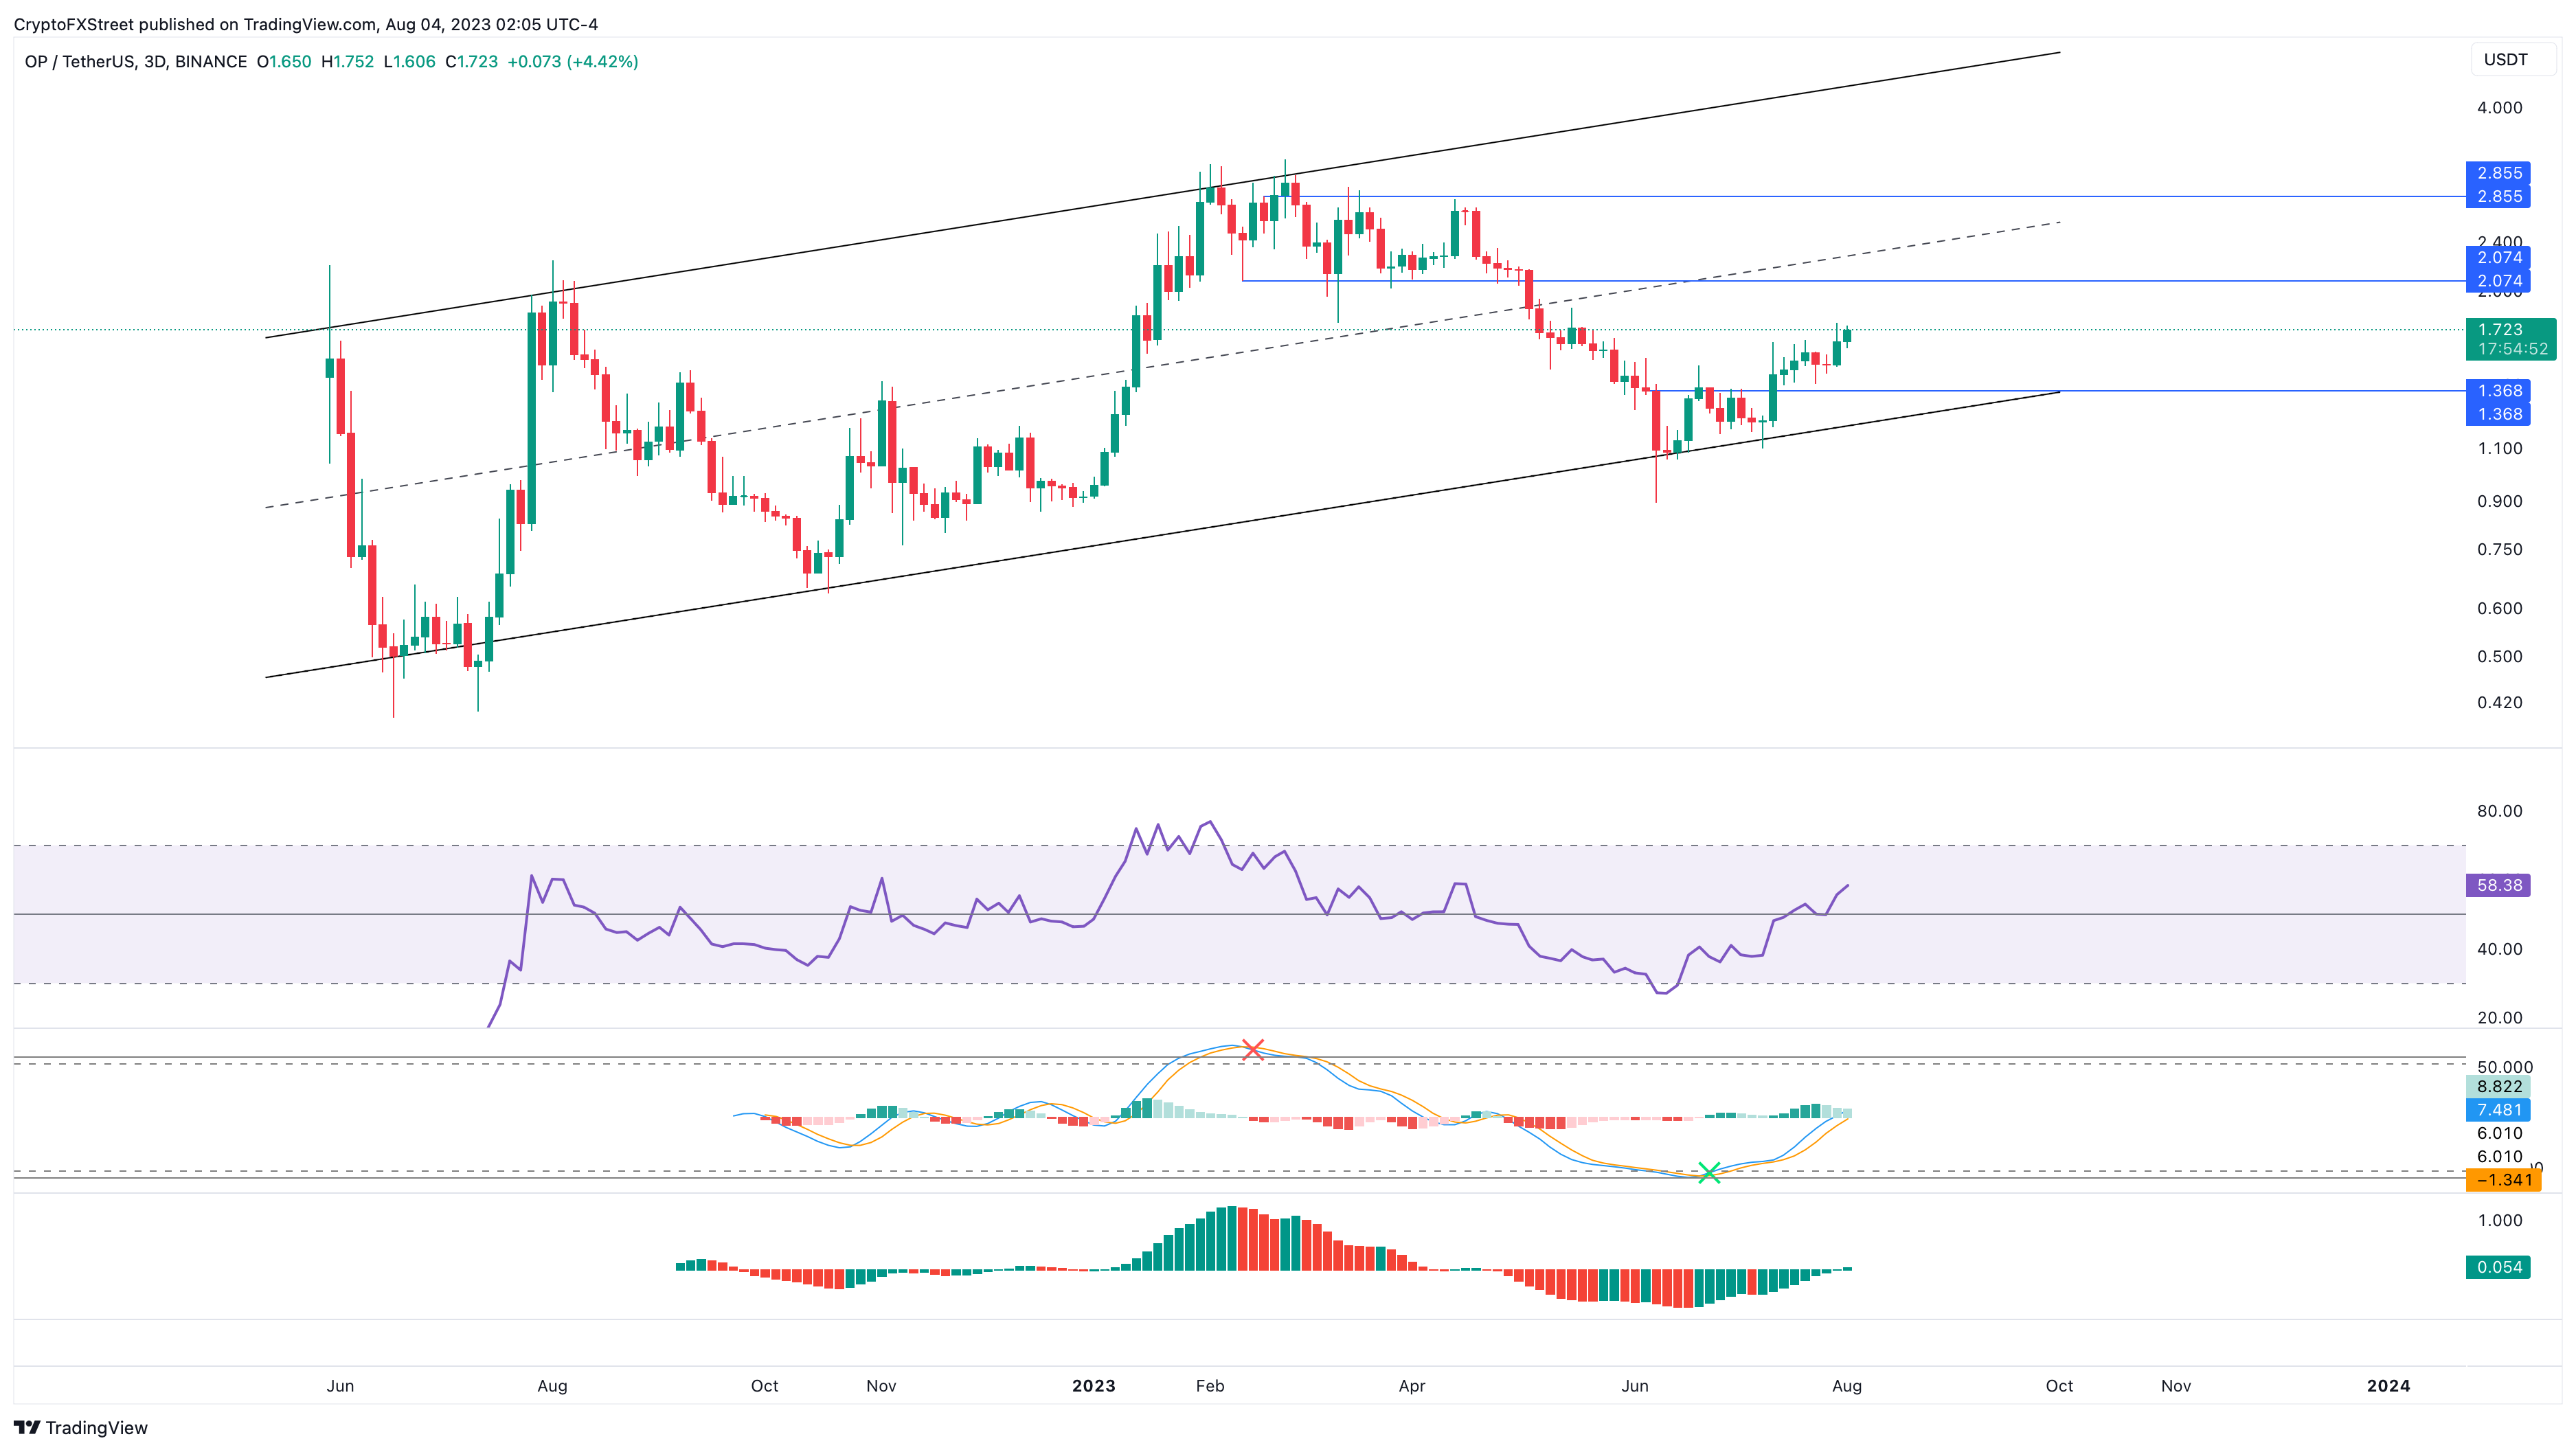
OP/USDT 3-day chart
Extremely bullish scenario for OP enthusiasts
Layer 2 tokens have been a crowd favorite since their inception. Take Polygon, for example. Apart from being a solid project with great fundamentals, their native token MATIC saw a 17,000% rally during the 2021 bull run.
Although the market conditions or sentiment are nowhere near the 2021 bull run, the fundamentals of the Optimism project are sound. Even if Optimism price experienced a fraction of the traction that Polygon’s MATIC did, OP could pull a 600% move.
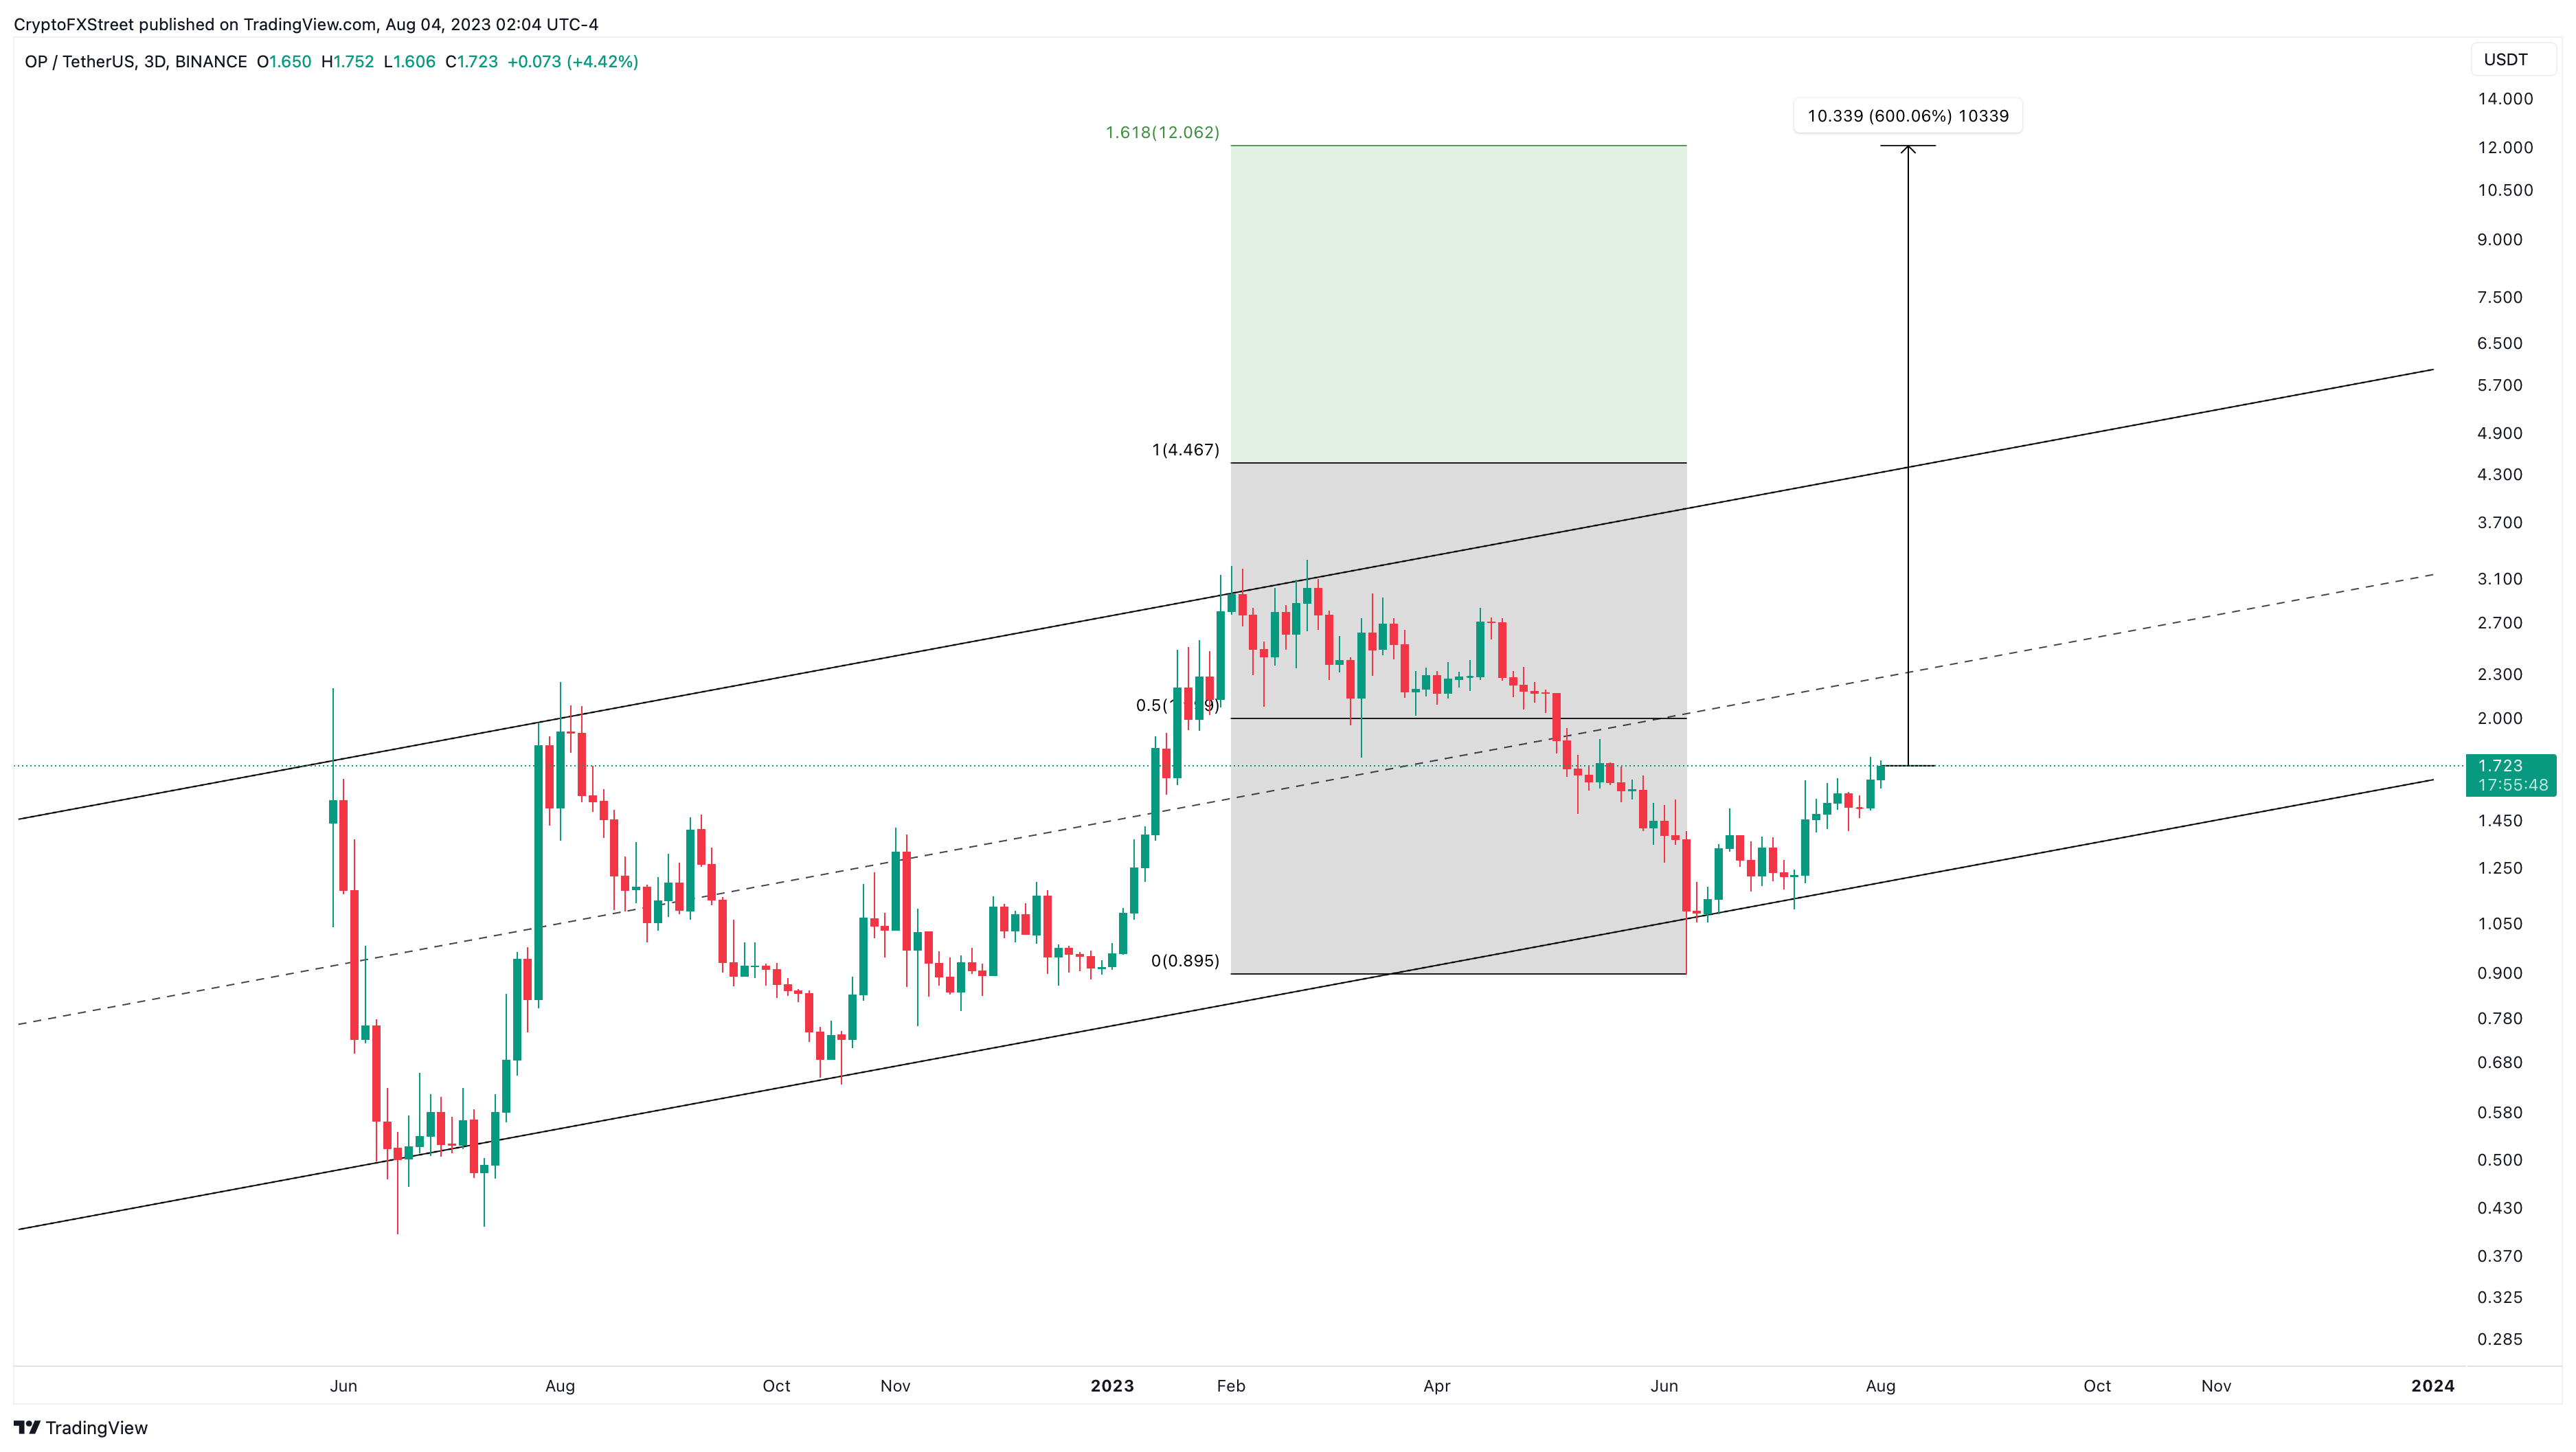
OP/USDT 3-day chart
While the conservative outlook makes sense, the extreme-case scenario should be taken with a grain of salt. The cryptocurrency space is where many altcoins experience massive volatility. For example, the investor that purchased $8,000 dollars worth of SHIB turned it into $5.7 billion in the 2021 bull market.
Like this article? Help us with some feedback by answering this survey:
Author

Akash Girimath
FXStreet
Akash Girimath is a Mechanical Engineer interested in the chaos of the financial markets. Trying to make sense of this convoluted yet fascinating space, he switched his engineering job to become a crypto reporter and analyst.