Optimism price slips under critical support as $40 million worth of OP due to flood market Thursday
- Optimism network will be unlocking 24.16 million OP tokens, constituting 2.74% of total supply, on November 30.
- Worth $40.59 million at current rates, the cliff unlock event is poised to trigger volatility in the L2 token’s price.
- OP could drop amid increased supply, with token allocations going to investors and core contributors who may cash in.

Optimism (OP) price has slipped below a critical support level, coming on the back of increased volatility ahead of a bearish catalyst expected in the Optimism network on November 30.
Also Read: Optimism Price Forecast: OP to correct 15% as sell signs multiply
Optimism price prepares for voluminous token unlock
Optimism (OP) price has dropped 5% in the last day, but trading volume is up a stark 15% over the last 24 hours as of press time. The disparity comes amid expectations of more tokens in the OP market relative to what traders are willing to buy at current prices.
Based on the token unlock calendar, the Optimism network will be unlocking 24.16 million OP tokens worth approximately $40.59 million on November 30. The dump constitutes 2.74% of the network’s supply, with allocations going to investors and core contributors, who are expected to cash in for quick profit.
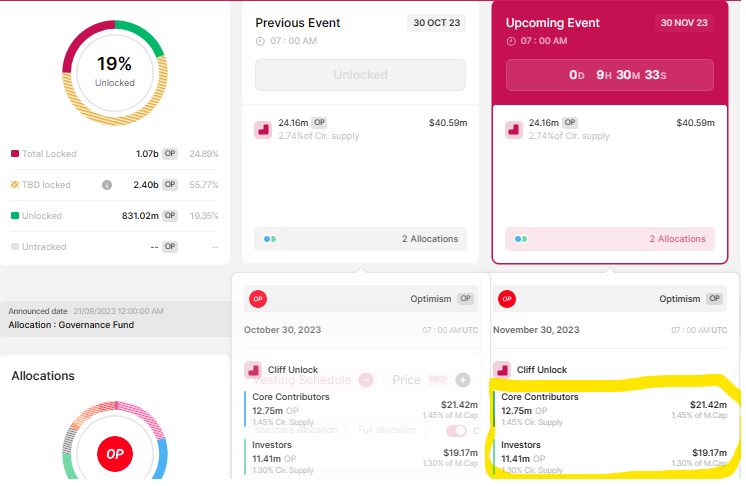
OP unlocks
During previous unlocks, the event triggered volatility in the Optimism price, oscillating at least 10% in either direction before and after the event.
Optimism price prediction ahead of massive token unlocks
Optimism price has fallen back below the mean threshold of $1.723 of a supply zone extending from $1.653 to $1.818. Based on the outlook of the Relative Strength Index (RSI), OP could fall further, with the bears steadily strengthening their position in the market.
The inclination of the RSI to the south shows buying pressure is fading relative to selling pressure, possibly as investors flee to avoid being caught as part of exit liquidity. In the same way, the Awesome Oscillator (AO) is edging to the south as red-hot histogram bars show the bears gaining ground.
Increased selling pressure could see Optimism price extend the fall, falling outside the grip of the supply zone at $1.818 to test the $1.600 psychological level. If this floor fails to hold as support, the slump could extend to tag the $1.449 support floor, 15% below current levels.
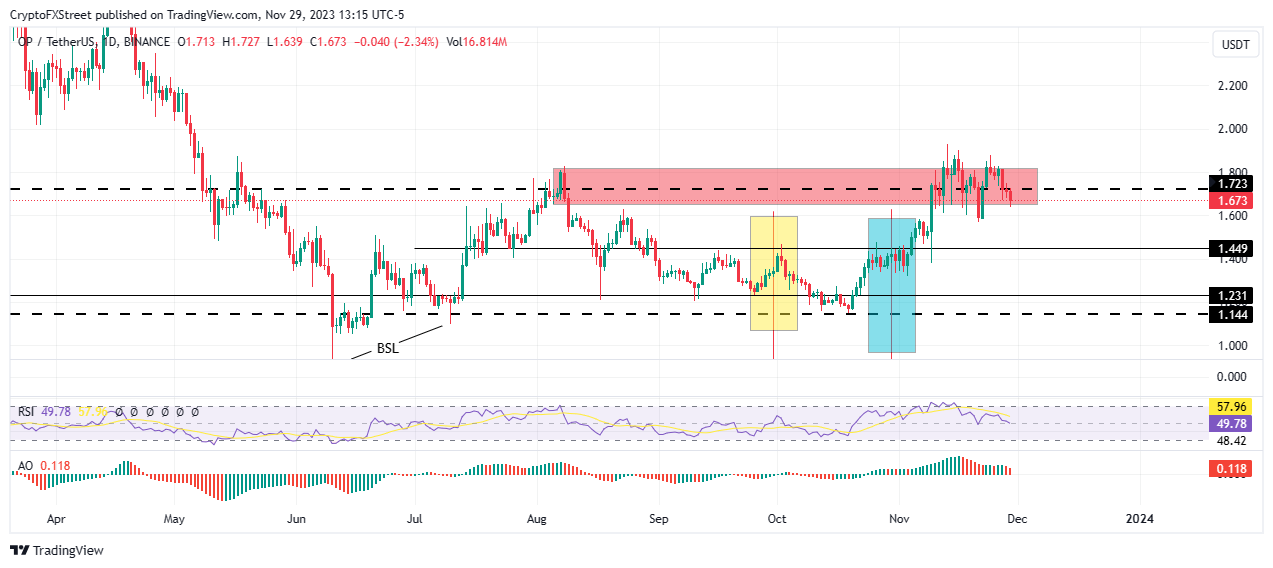
OP/USDT 1-day chart
On-chain metrics to support the bearish case for Optimism
On-chain data from Santiment shows that Tether (USDT) stablecoin market capitalization has been waning, suggesting there is no fresh capital flowing into the OP market. With it, the daily active addresses have also dwindled, showing the number of daily unique addresses involved in OP transactions continues to reduce. Crowd interaction around OP is fading as well.
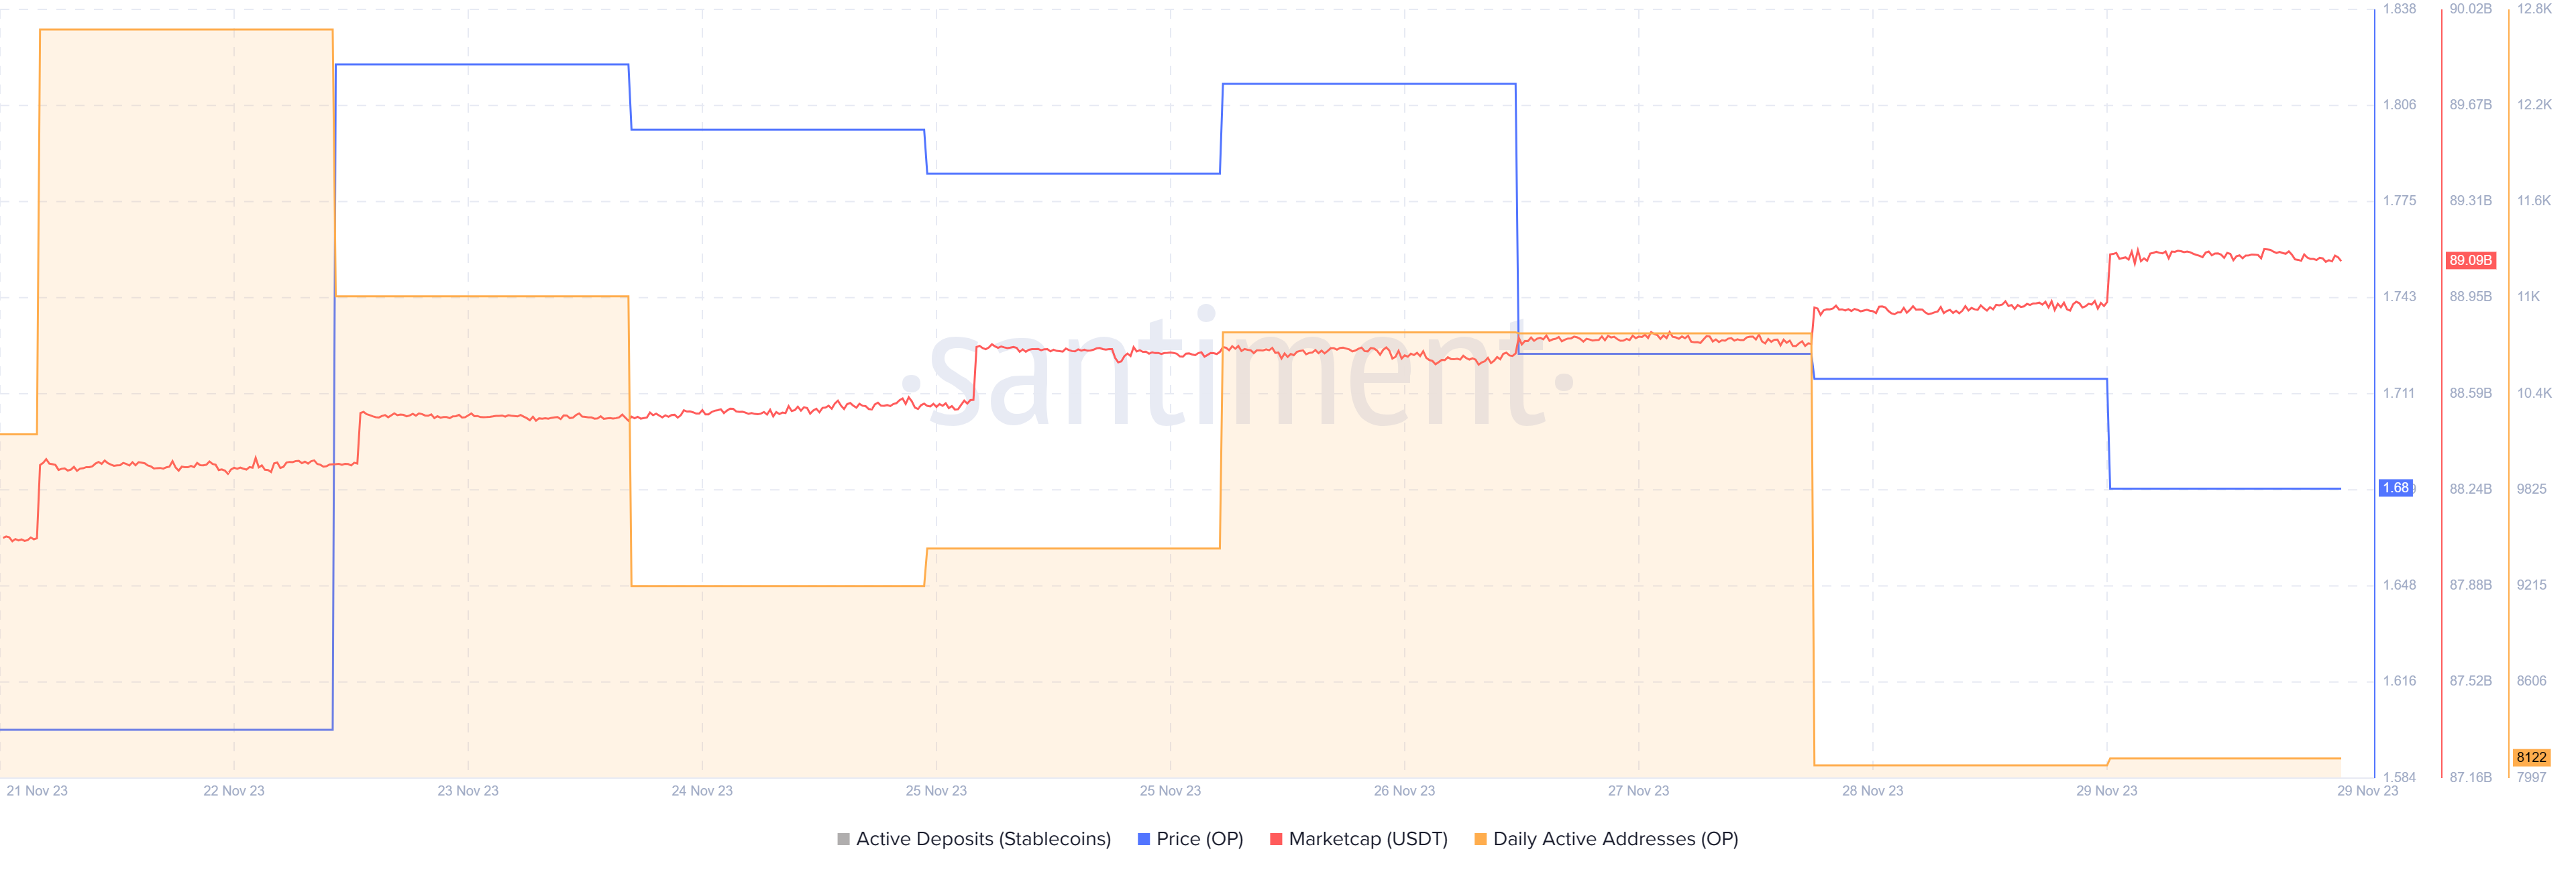
OP Santiment: USDT market capitalization, daily active addresses
In the same way, network growth is declining, showing the number of new addresses being created is dipping. Transaction count and transaction volume metrics are dwindling with investors shunning OP amid increased risk in the market. These metrics show the aggregate amount of OP tokens across all transactions that happen on the network daily.
 [22.16.12, 29 Nov, 2023]-638368845154394855.png)
OP Santiment: Network growth, transaction volume, transaction count
On the other hand, a resurgence by bulls could send Optimism price north, reclaiming the mean threshold of $1.723 back as support and potentially extending past the upper boundary at $1.653. In a highly bullish case, the gains could extend north for OP market value to tag $1.800, 7% above current levels.
In highly ambitious cases, Optimism's price could reach higher, clearing the local tops to tag the $2.000 psychological level.
Author

Lockridge Okoth
FXStreet
Lockridge is a believer in the transformative power of crypto and the blockchain industry.



