Optimism Price Forecast: OP to correct 15% as sell signs multiply
- Optimism price struggles below the $1.86 and $1.80 resistance levels.
- If OP produces a lower high below $1.86, it could signal the start of a downtrend.
- Such a development could trigger a 15% pullback.
- Invalidation of the bearish outlook will occur on the flip of the $1.86 support level.
Optimism (OP) price has shot up 64% in the last three weeks or so. This OP rally seems to be coming to a certain pause as multiple sell signals emerge on the daily chart.
Read more: Optimism price rally gets boost from OP token accumulation
Optimism price ready to slide lower
Optimism (OP) price rallied 64% in under 25 days, starting from October 20 to November 13 and set up a local top at $1.98. This impressive uptrend now faces two critical resistance levels at $1.86 and %1.80.
Additionally, the Momentum Reversal Indicators (MRI) flashed a red “one” sell signal on the daily time frame. Although OP rallied 13% after this sell signal, OP holders are slowly booking profits. As a result, Optimism price has now slid by 10% and currently sits around $1.66.
The Relative Strength Index (RSI) and Awesome Oscillator (AO) are both showing signs of declining bullish momentum. Investors need to be cautious as the RSI approaches the 50 mean level. Here, OP could either bounce or slide lower.
A breakdown of the 50 mean level could see the Optimism price trigger a 15% correction to the next support level at $1.40. In some cases, OP could slide lower and tag the $1.31 barrier.
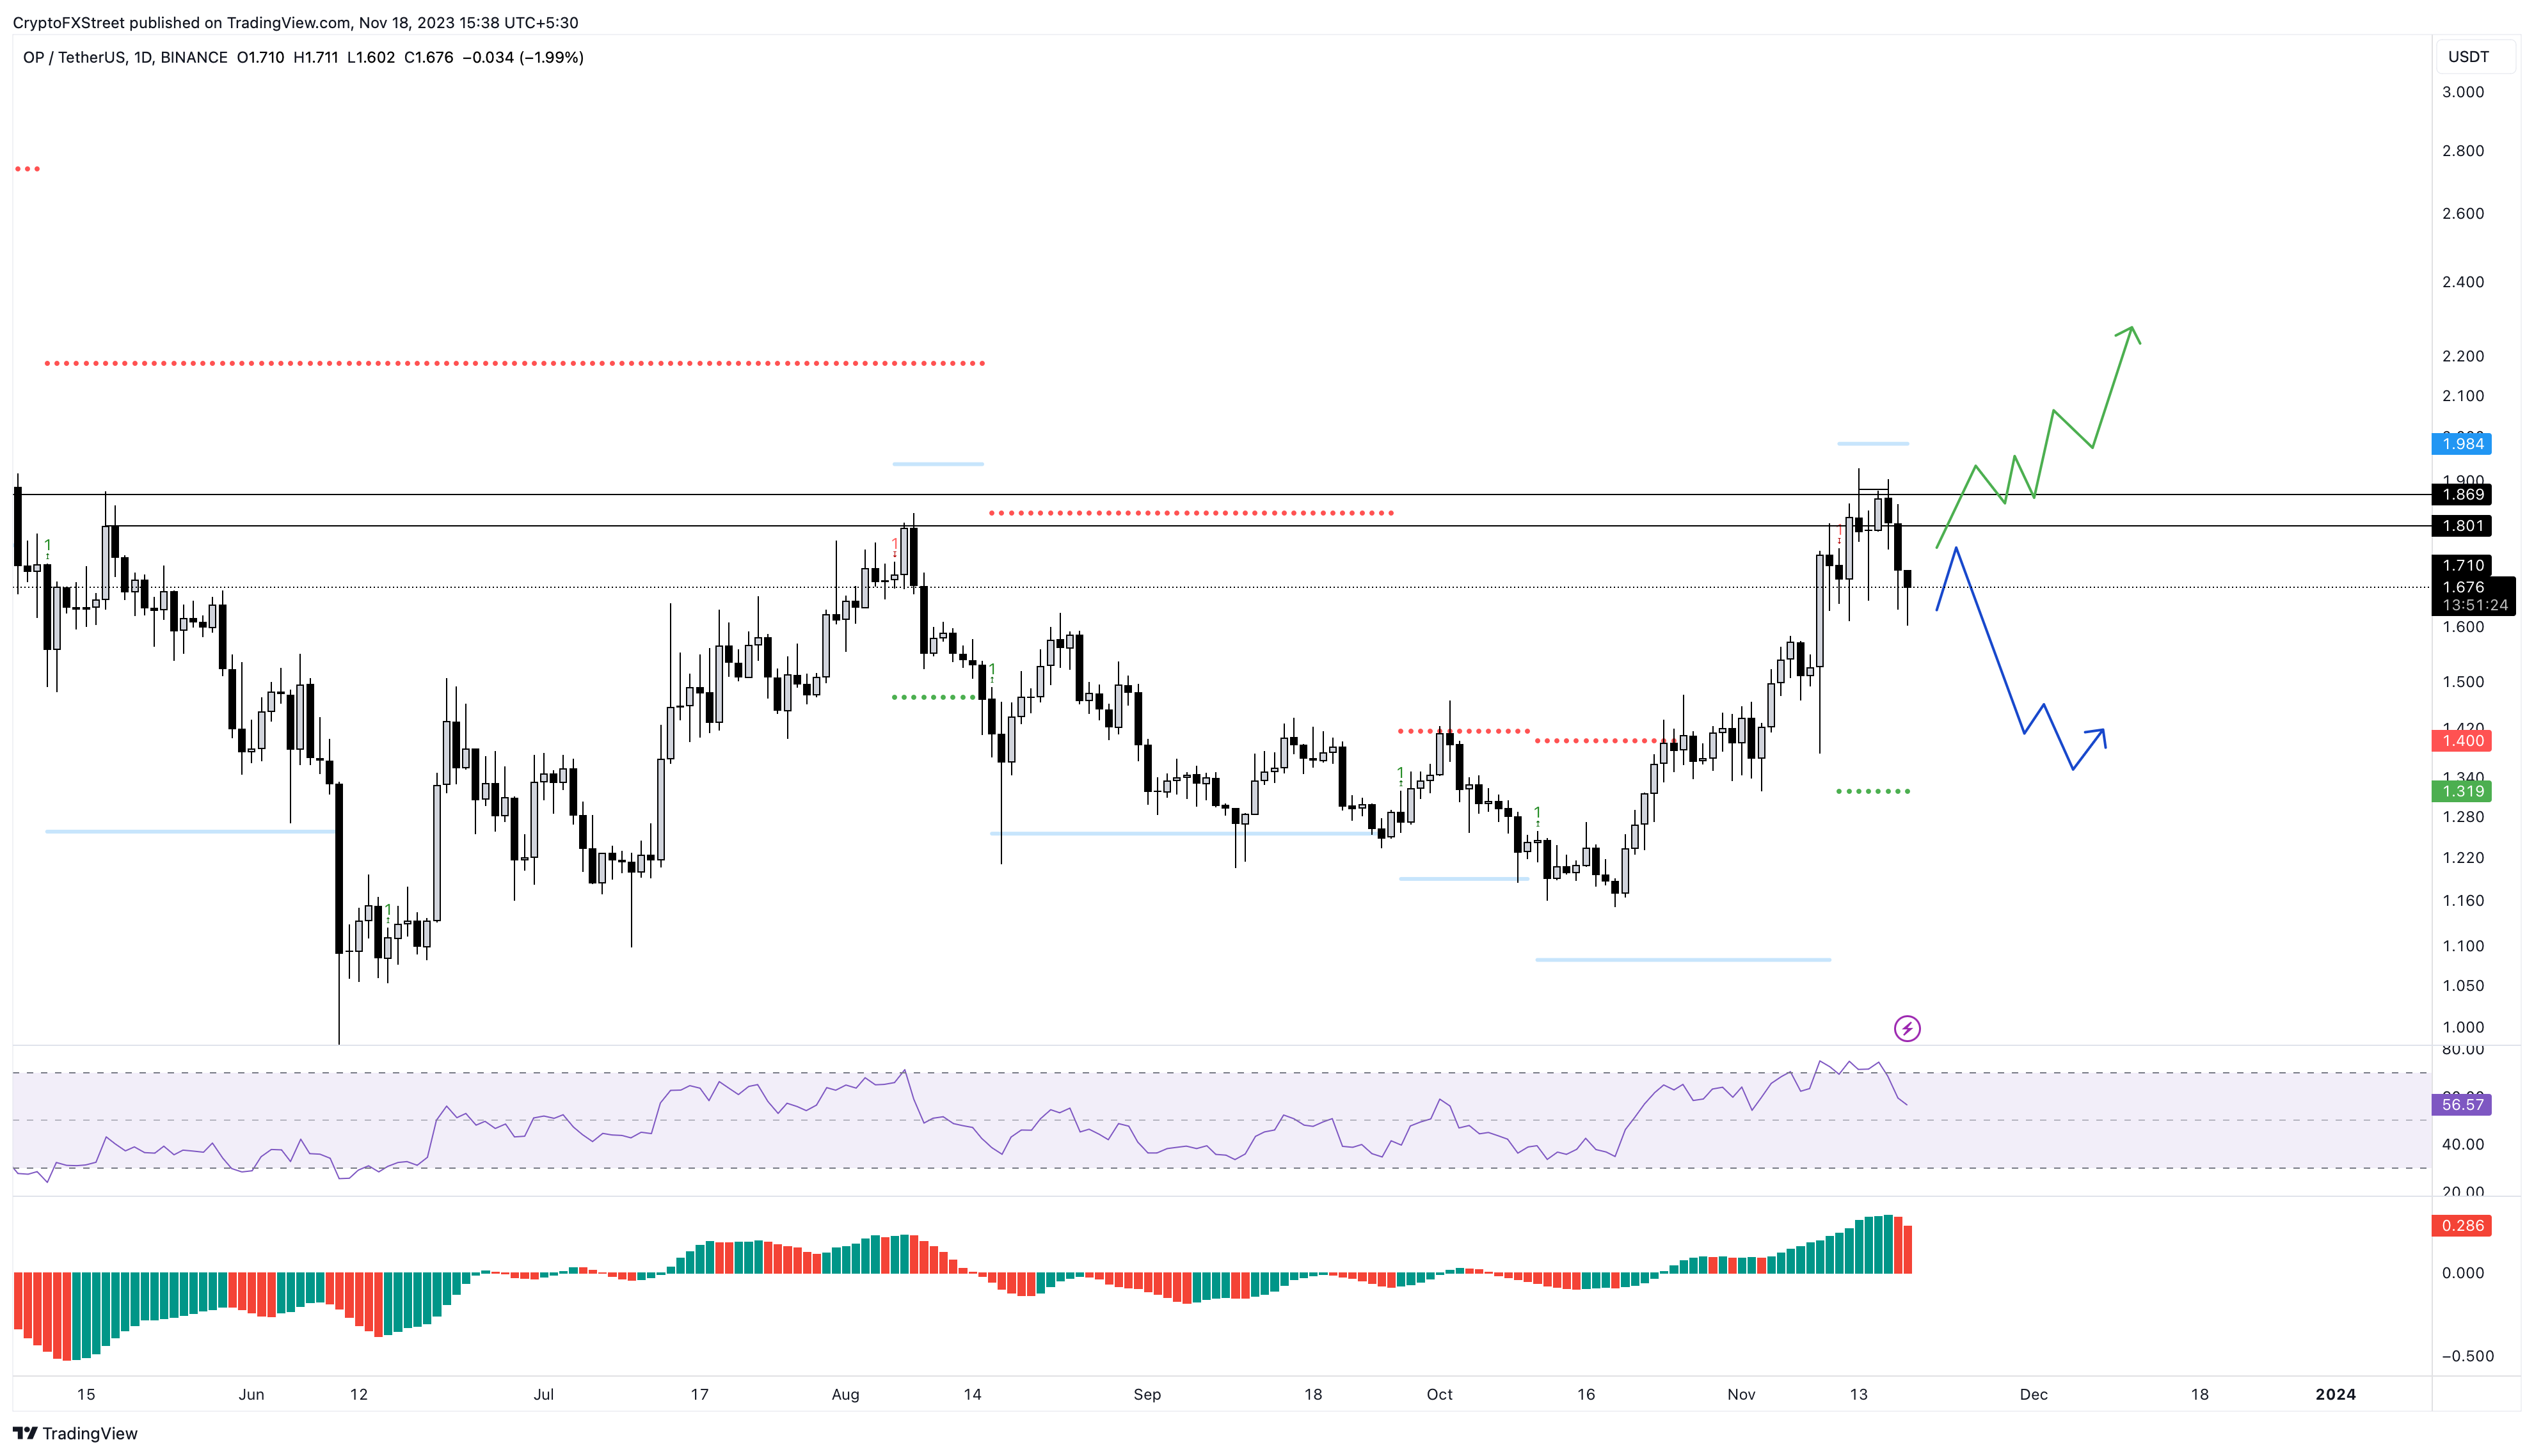
OP/USDT 1-day chart
On the other hand, if Optimism price sees a sudden spike in buying pressure, it could reverse the trend and climb higher. In such a case, a daily candlestick close above $1.86 that flips this hurdle into a support floor will invalidate the bearish thesis.
Despite this development Optimism price needs to overcome the breakout level at $1.98, which could kickstart a 10% rally to $2.20.
Author

Akash Girimath
FXStreet
Akash Girimath is a Mechanical Engineer interested in the chaos of the financial markets. Trying to make sense of this convoluted yet fascinating space, he switched his engineering job to become a crypto reporter and analyst.


