Ontology Gas sets for a rally as technicals show bullish divergences
- Ontology Gas price broke above a descending parallel channel pattern, suggesting a bullish move ahead.
- RSI and AO indicators form bullish divergences in the daily chart, signaling a potential trend reversal.
- A daily candlestick close below $0.240 would invalidate the bullish thesis.
Ontology Gas (ONG) price broke out above a descending parallel channel pattern, indicating a potential bullish momentum ahead. The bullish divergence observed on the Relative Strength Index (RSI) and the Awesome Oscillator (AO) indicators further suggests a likely reversal and upward trajectory for ONG in the days ahead.
Ontology Gas price sets for a rally
Ontology Gas price broke above the descending parallel channel pattern on Saturday and rallied 9.5% over the next three days. At the time of writing, ONG trades 1% up to $0.342 on Wednesday.
Additionally, the formation of a lower low on the daily chart on July 5 contrasts with the Relative Strength Index (RSI) indicator’s higher high during the same period. This development is termed a bullish divergence and often leads to the reversal of the trend or a short-term rally.
If the upper trendline of the descending parallel channel pattern holds as throwback support at around $0.299, ONG could rally 33% from that level, targeting its daily high of $0.400 from June 21.
Moreover, if ONG closes above $0.400, it could extend an additional rally of 11% to revisit its daily resistance at $0.443.
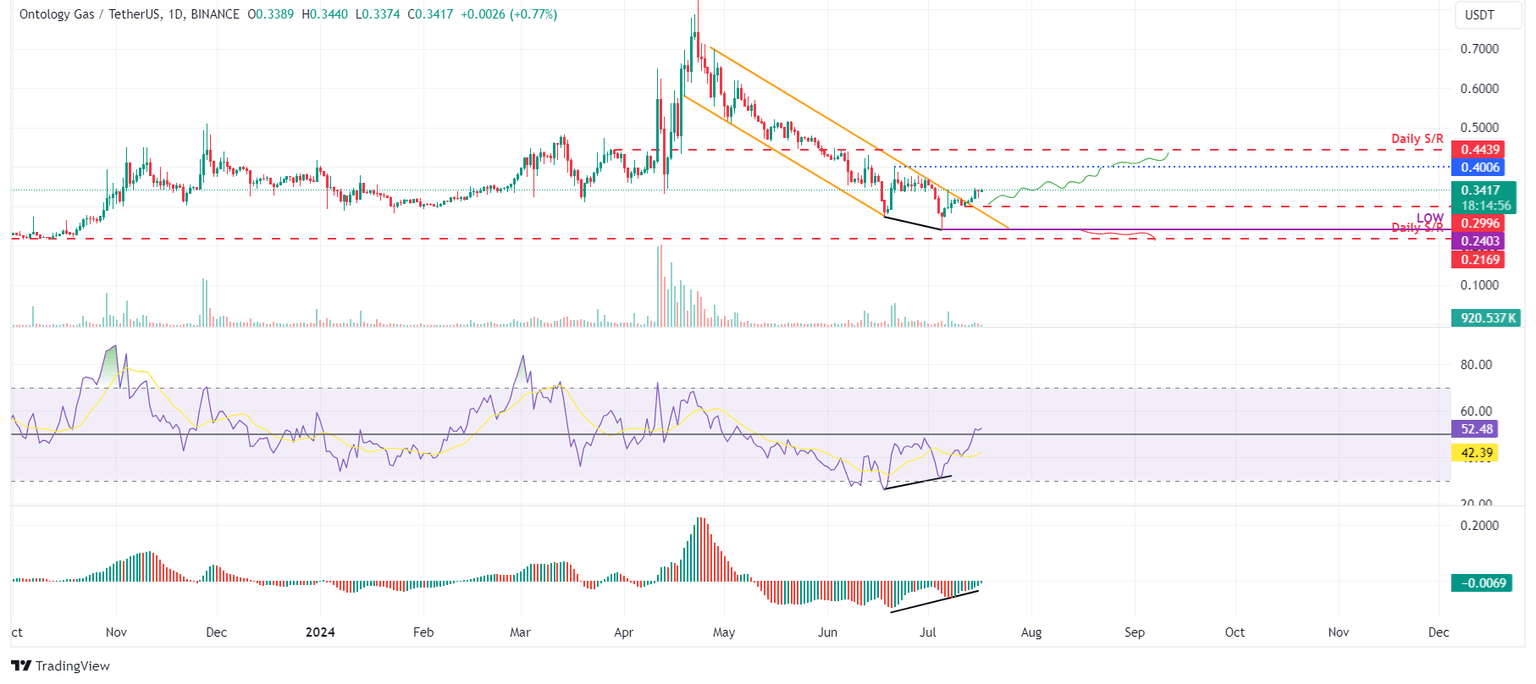
ONG/USDT daily chart
Despite the bullish outlook pictured by technical analysis, if Ontology Gas price posts a daily candlestick close below $0.240, it will form a lower low. This scenario would signal a bearish outlook, possibly leading to a price fall of around 10% to the next daily support level of $0.216.
Author

Manish Chhetri
FXStreet
Manish Chhetri is a crypto specialist with over four years of experience in the cryptocurrency industry.


