MAGA (TRUMP) eyes for a rally following a breakout above the descending trendline
- MAGA price breaks above the descending trendline, suggesting a bullish move.
- Sideline buyers can accumulate TRUMP around $6.576 daily support level.
- A daily candlestick close below $4.579 would invalidate the bullish thesis.

MAGA (TRUMP) has breached the descending trendline, indicating a potential bullish trend. Investors on the sidelines may consider accumulating TRUMP near the $6.576 daily support level ahead of a potential upside rally in the coming days.
MAGA price shows potential for an upside move
MAGA price broke above the descending trendline and the daily resistance level at $6.576 on Saturday and rallied 19% the next day to retest its daily high of $10.401 from June 27.
MAGA encounters resistance at the $10.401 level and, at the time of writing, trades 1% down at the $7.511 level on Monday.
If the trendline holds as throwback support roughly coincides with the daily support level around $6.576, TRUMP’s price could surge 58.5% and retest its daily high of $10.401 from June 27.
The Relative Strength Index (RSI) is currently above the neutral level of 50 on the daily chart, and the Awesome Oscillator (AO) is also approaching its neutral level of zero. If bullish momentum continues, both indicators must stay above their average levels to support the ongoing recovery rally. This would contribute positively to the upward movement.
If TRUMP's price closes above $10.401, it could initiate a 36% further rally, aiming to retest its next daily resistance of $14.127.
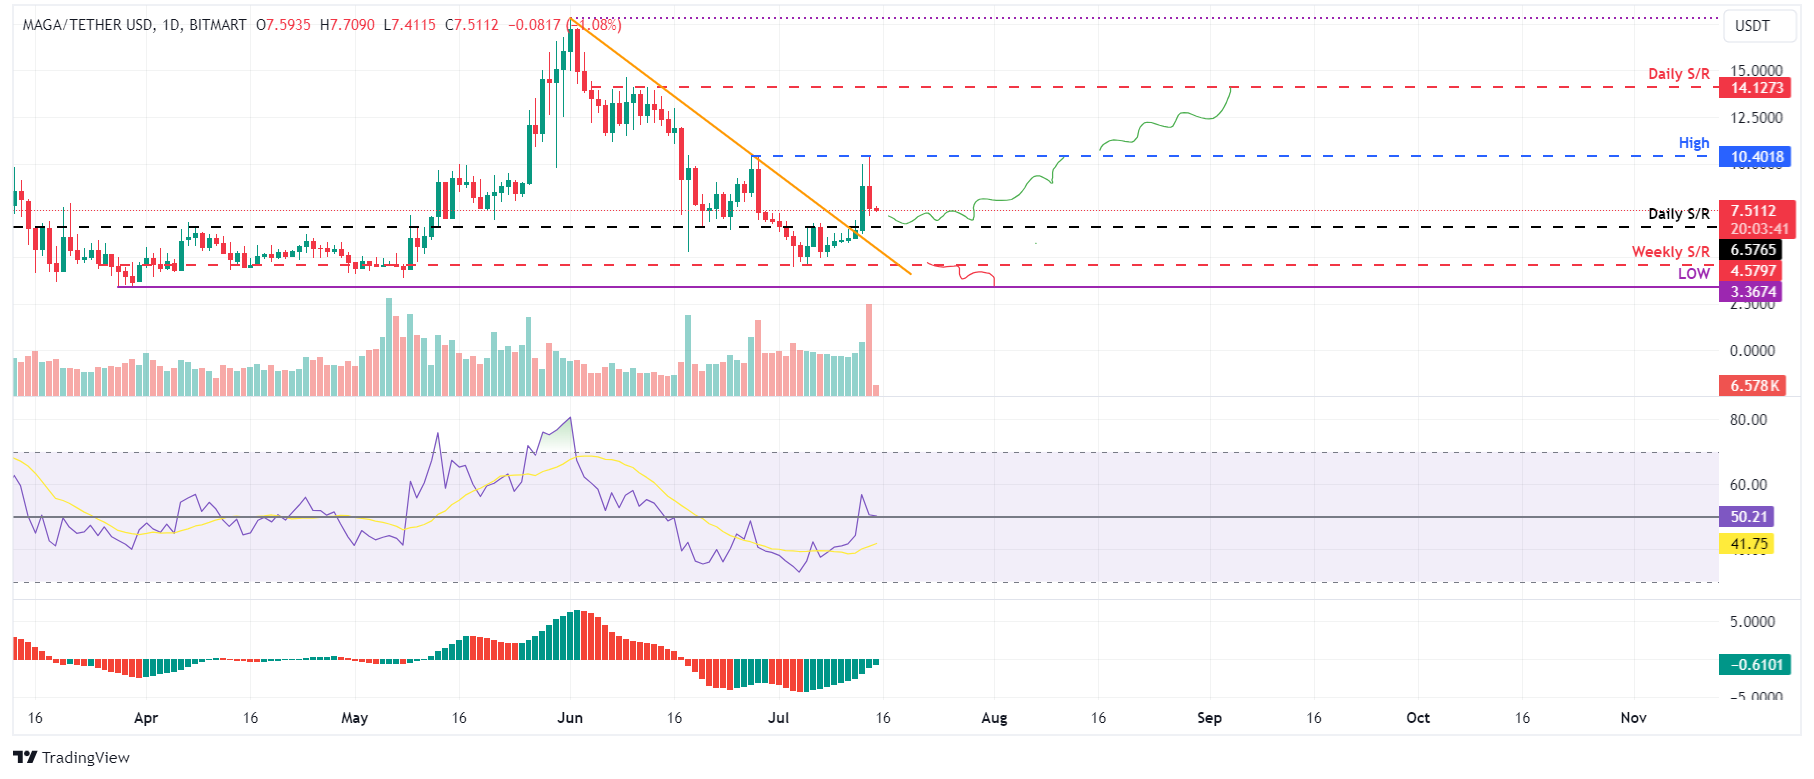
TRUMP/USDT daily chart
However, if TRUMP closes below $4.579, resulting in a lower low on the daily timeframe, it would nullify MAGA's bullish thesis. This scenario could trigger a 25% crash, revisiting its March 28 low of $3.367.
Author

Manish Chhetri
FXStreet
Manish Chhetri is a crypto specialist with over four years of experience in the cryptocurrency industry.


