Top 3 Price Prediction Bitcoin, Ethereum, Ripple: Bitcoin surpasses $65,000 mark
- Bitcoin price closes above the daily resistance level of $64,900, signaling a bullish move.
- Ethereum price bulls take $3,240 threshold, indicating a transition to an upward bias.
- Ripple price breaches the daily resistance level of $0.574, signaling a potential bullish trend on the horizon.

Bitcoin (BTC) closes above the daily resistance level of $64,900, with Ethereum (ETH) and Ripple (XRP) subsequently breaking through their resistance levels, indicating an emerging bullish trend.
Bitcoin price action signals bullish trends ahead
Bitcoin price surged above a descending trendline last Sunday, marking a 7% rally over the following two days and achieving a close above the daily resistance level of $64,913 by Tuesday. As of today, BTC is trading slightly up by 1.1% at $65,622 on Wednesday. Such a strong upward momentum often precedes a retracement, presenting a potential buying opportunity for investors on the sidelines.
Sideline buyers seeking opportunities can consider positions between the $59,200 and $57,800 levels, where the previously broken trendline resistance now serves as support. However, should BTC sustain its bullish momentum, it may advance by 2.5% from its current trading price of $65,622 to test the weekly resistance of around $67,209.
On the daily chart, the Relative Strength Index (RSI) is currently above the neutral level of 50, and the Awesome Oscillator (AO) has also flipped above its neutral level of zero. These momentum indicators strongly indicate bullish dominance.
Furthermore, surpassing the $67,209 level could allow an additional 7% rise to retest its daily high of $71,997 from June 7.
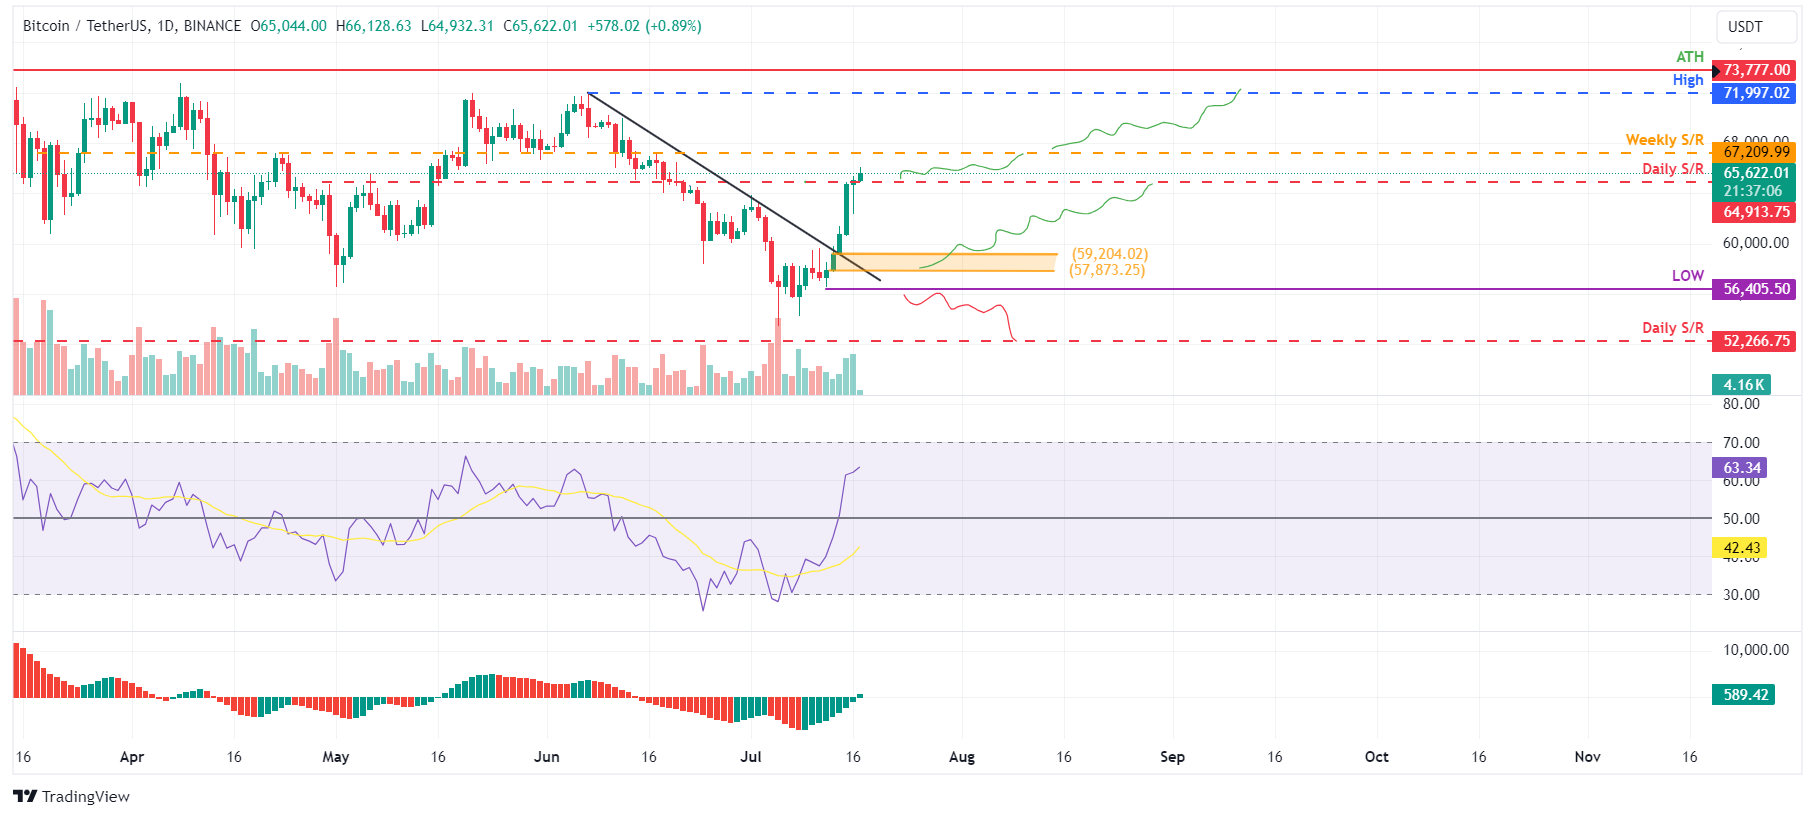
BTC/USDT daily chart
Conversely, if BTC closes below $56,405 and forms a lower low in the daily timeframe, it may signal persistent bearish sentiment. This scenario could trigger a 7.5% decline in Bitcoin's price, targeting a revisit of its daily support at $52,266.
Ethereum price shows potential for a rally
Ethereum price broke above the $3,240 level on Sunday and rallied 7.36% in the next two days. It is 1% up at $3,486 on Wednesday at the time of writing.
If the $3,240 level holds as support and ETH closes above the $3,524 level, it could increase 6%, targeting a retest of its daily high from June 9 at $3,721.
The Relative Strength Index (RSI) on the daily chart is trading above the neutral level of 50, and the Awesome Oscillator (AO) is on its way to doing the same. If bulls are indeed making a comeback, then both momentum indicators must maintain their positions above their respective mean levels. Such a development would add a tailwind to the recovery rally.
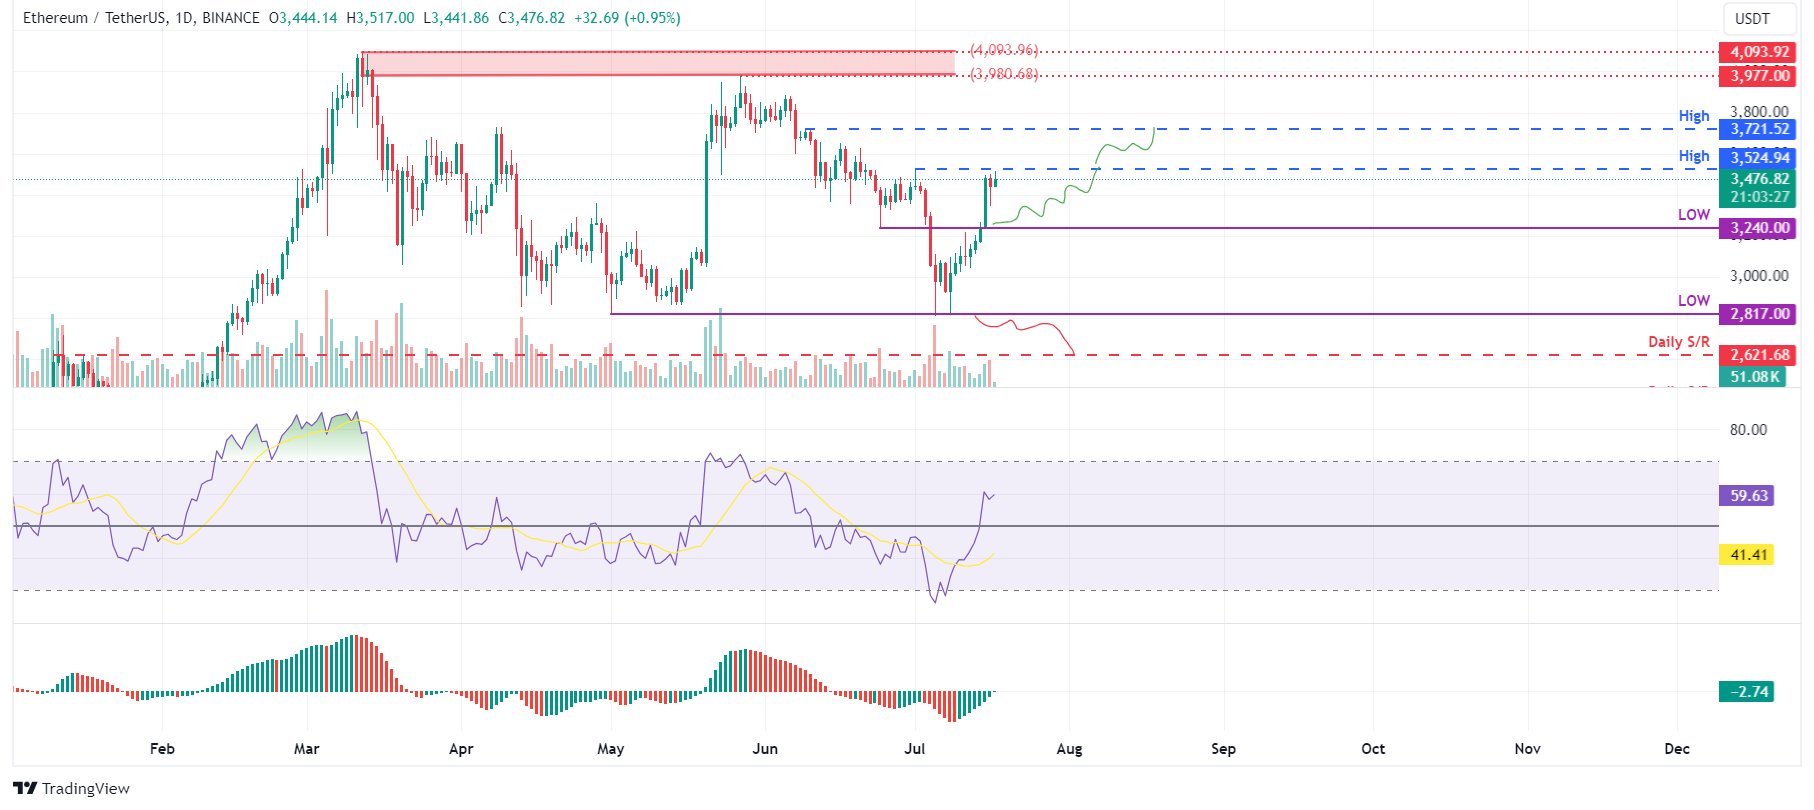
ETH/USDT daily chart
On the other hand, if Ethereum's daily candlestick closes below $2,817, forming a lower low in the daily timeframe, it may signal persistent bearish sentiment. This scenario could trigger a 7% decline in Ethereum's price, targeting a revisit of its daily support at $2,621.
Ripple price eyes a bullish move
Ripple price broke above the daily resistance level of $0.574 on Tuesday and is currently 1% up at $0.585 on Wednesday.
If XRP holds above the $0.574 level, it could rally 12% to retest its daily high from April 9 at $0.643.
On the daily chart, the Relative Strength Index (RSI) and the Awesome Oscillator (AO) are currently positioned above their critical thresholds of 50 and zero, respectively. These momentum indicators strongly indicate bullish dominance.
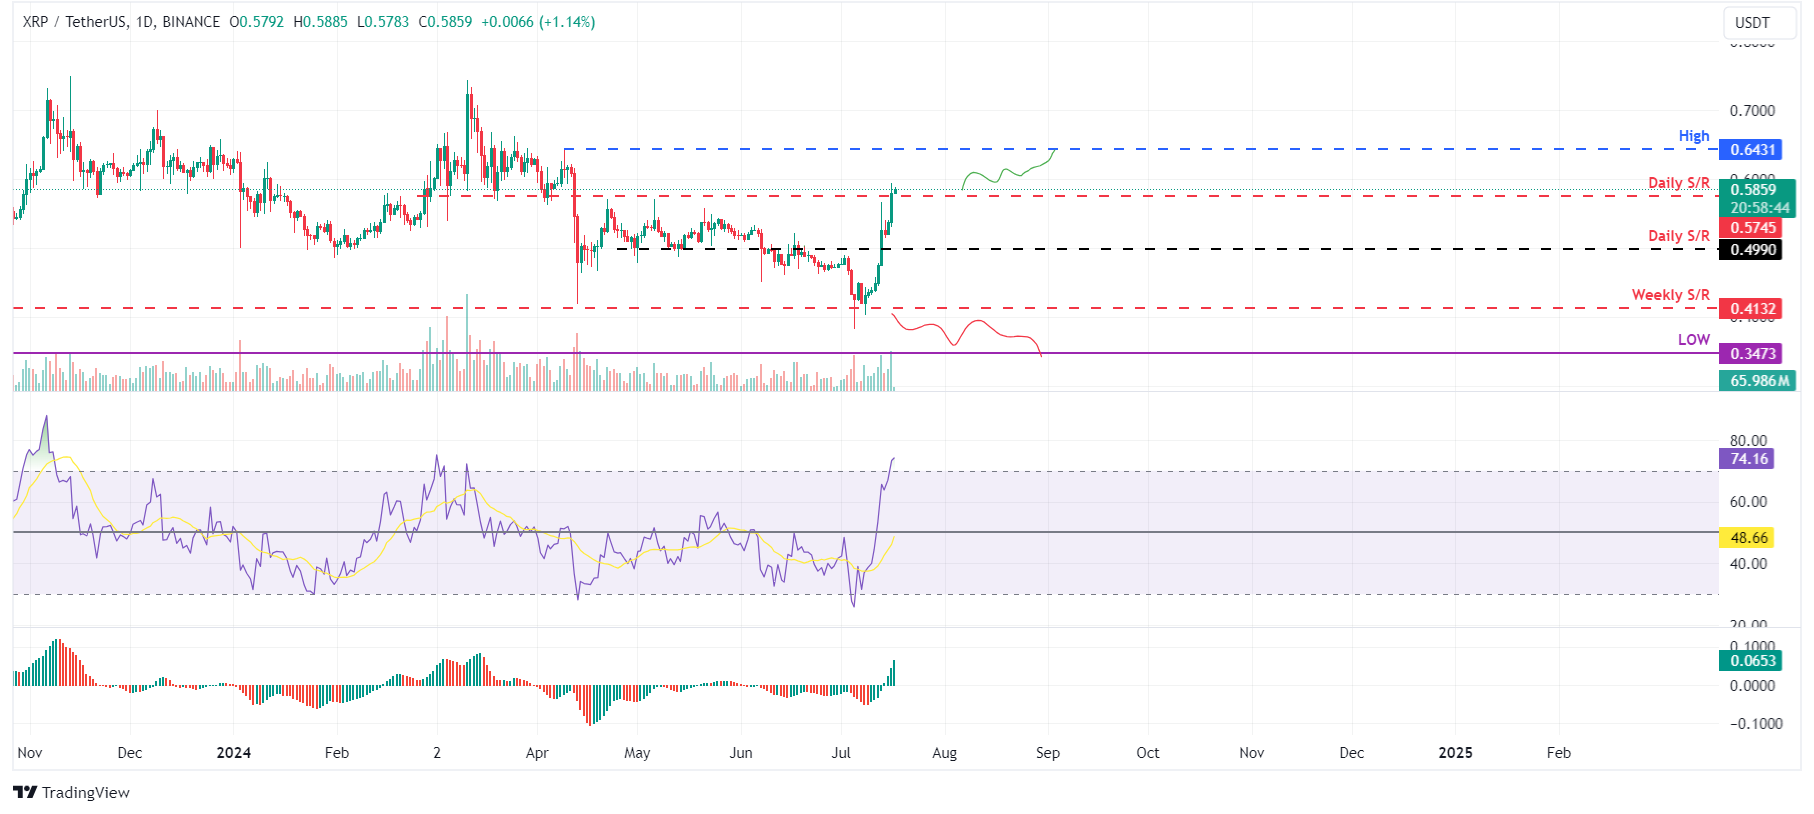
XRP/USDT daily chart
However, if Ripple's daily candlestick closes below $0.413, it indicates sustained bearish sentiment, forming a lower low in the daily timeframe. Such a scenario could lead to a 16% decline in Ripple's price, targeting a revisit of its low from March 12 at $0.347.
Author

Manish Chhetri
FXStreet
Manish Chhetri is a crypto specialist with over four years of experience in the cryptocurrency industry.


