Here’s why Ondo price hit new ATH amid bearish market outlook
- Ondo price continues to rise in the face of struggling altcoins.
- The RWA narrative kickstarted by Blackrock is one of the reasons for this rally.
- ONDO could set up an ATH, but short-term investors should watch out for a correction.

Ondo price shows no signs of slowing down after setting up an all-time high (ATH) at $1.05 on March 31. This development is likely to be followed by a correction and ATH but not necessarily in that order.
Also read: Ethereum shows signs of a potential rally as suspected Justin Sun wallet buys heavily
Ondo price rally seems unstoppable
Ondo price has been on an uptrend since it debuted in January. ONDO has surged 433% since February 1 and set up an ATH of $1.05 on March 31. The altcoin has consistently produced higher highs and higher lows, showing no signs of slowing down.
The main reason behind ONDO’s ascent is Blackrock, a multi-billion dollar US-based investment company. Blackrock was responsible for kickstarting the Bitcoin bull run after it filed its spot ETF application in mid-June.
The so-called Blackrock effect spilled over to the Real-World Asset (RWA) category when the investment firm announced an Ethereum-based tokenized fund on March 20. Interestingly, the people's favorite, Ondo price, formed a bottom on March 20 and kickstarted its 172% rally to ATHs.
The RWA narrative is still alive due to the Blackrock effect, which is one of the main reasons why the Ondo price keeps going up. As a result of this ascent, ONDO’s 30-day correlation with Bitcoin has dropped to 0.34, a level not witnessed since February 19.
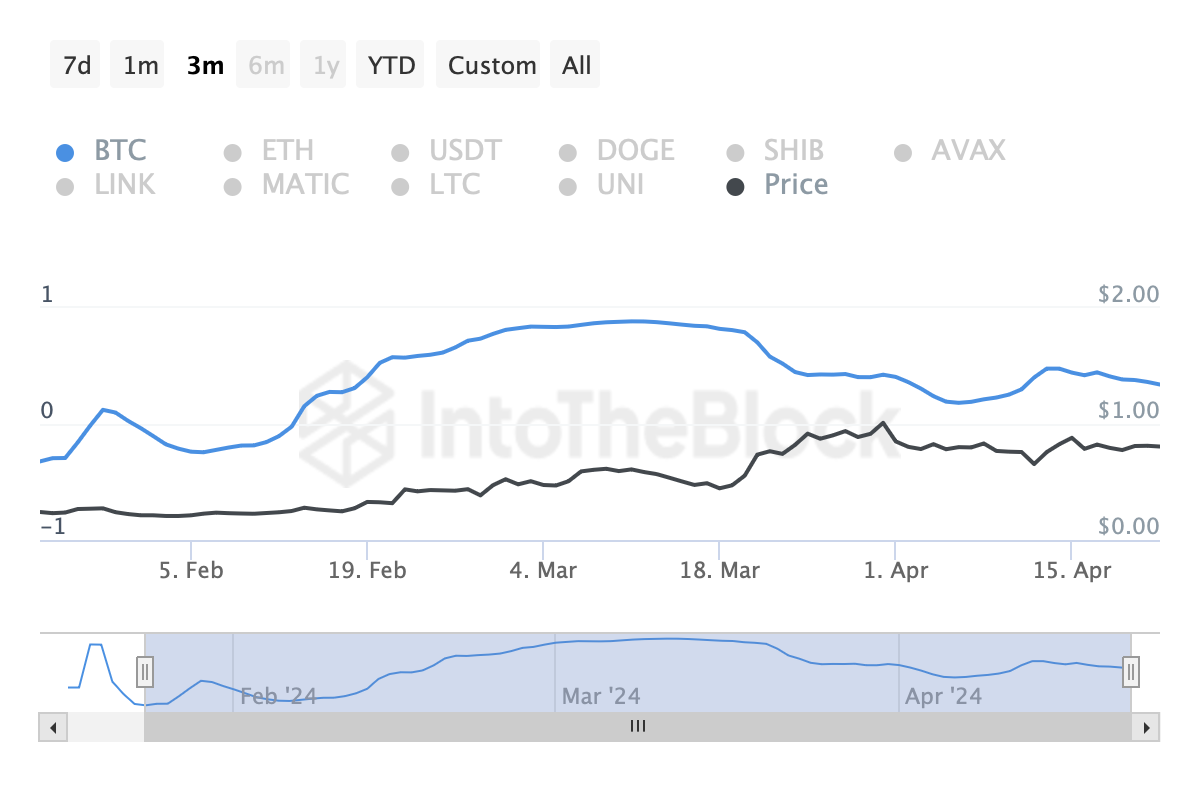
ONDO, BTC 30-day correlation
Read more: Ondo price eyes 30% rally as ONDO bulls plan a breakout
ONDO’s next move
A few aspects of the Ondo price action are required to analyze what could potentially come next.
- The horizontal support levels are at $0.633, $0.433, $0.282, and $0.214.
- The inclined trend line connecting three key swing points serving as a proxy of the uptrend and a support level.
- The ongoing rangebound movement between $0.693 and $0.977.
The consolidation spans approximately a month and could lead to a continuation of the rally or a minor correction. The reasoning behind this outlook is that every altcoin that is not purely driven by hype, FOMO, and retail frenzy is likely to correct unexpectedly that culls late longs and early shorts, allowing smart money to step in and accumulate before triggering another massive leg up.
Similar liquidity purging events occurred with Bitcoin price on March 11, 2023, August 14, 2023, and January 22, 2023. With Ondo, the March 19 crash was the last one. Although the April 12 crash did wipe out some of the liquidity, another sell-off or correction is likely for ONDO.
So, one of two things could occur for Ondo price, a correction below $0.633 followed by a rally that leads to new ATHs or a new ATH followed by a correction below $0.633. Considering the April 12 crash wiped a decent amount of late bulls’ long positions, the equal highs around the ATHs could attract a rally before a correction.
The Relative Strength Index (RSI) and Awesome Oscillator (AO) hover around the midpoint, suggesting a struggle between the bulls and bears.
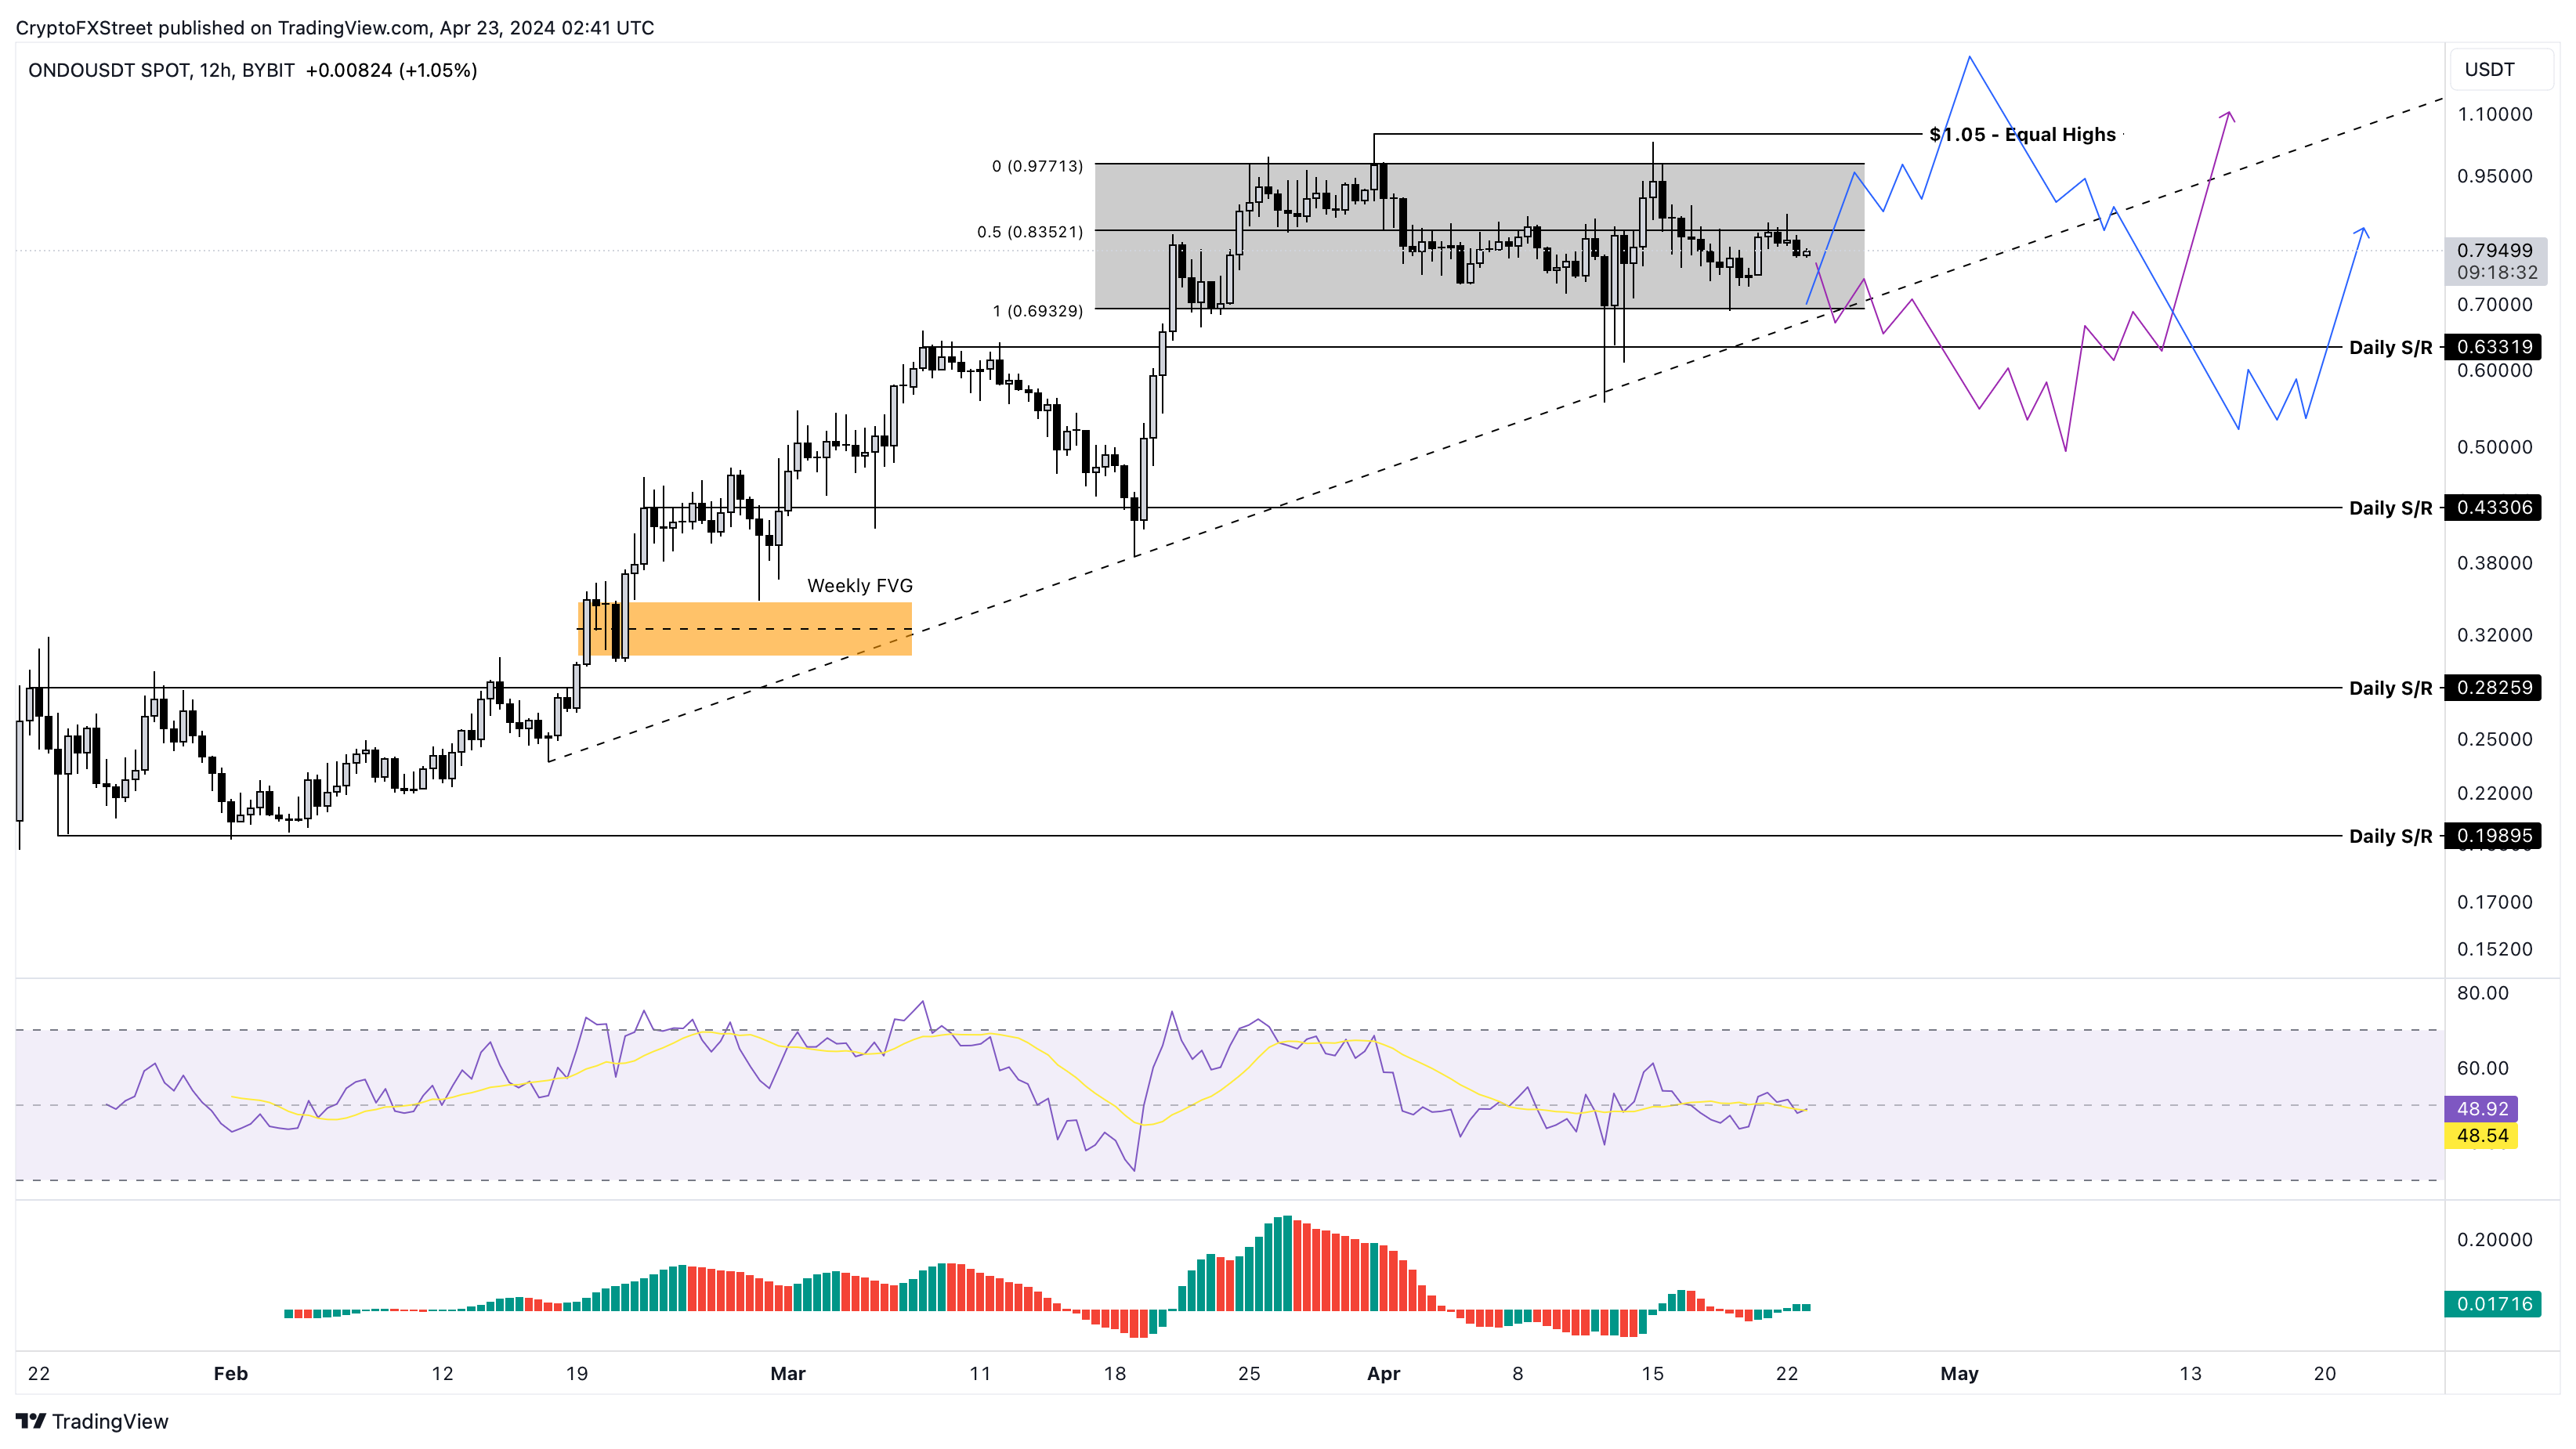
ONDO/USDT 12-hour chart
According to Santiment data, the 7-day Market Value to Realized Value (MVRV) ratio hovers close to the zero line. However, the 30-day MVRV is hovering at -9.39%, indicating that the average loss of investors who purchased ONDO in the past month is 9.39%.
A positive value indicates unrealized profits that could turn into potential selling pressure; hence, it is used as a sell signal. On the contrary, a negative value serves as a buying signal as it indicates that the short-term holders are underwater and the selling pressure will likely be absorbed by smart money investors.
 [08.17.47, 23 Apr, 2024]-638494397059489124.png)
ONDO 7-day, 30-day MVRV
Based on IntoTheBlock’s In/Out of the Money Around Price (IOMAP) model, the next key hurdle extends from $0.885 to $0.862, where roughly 2,300 addresses bought nearly 365 million ONDO at an average price of $0.875. Overcoming this key cluster of underwater investors could allow the Ondo price to ascend smoothly.
On the other hand, nearly 1,900 addresses purchased 301 million ONDO between the $0.767 to $0.743 range. The average buy-in price of these “In the Money” investors hovers around $0.759. If Ondo price drops lower, these investors could accumulate more to alleviate the selling pressure and act as a support level.

ONDO IOMAP
The bullish outlook for the Ondo price comes with a potential correction. Despite having a low correlation with Bitcoin, a sudden market sell-off for Bitcoin could disregard the positive outlook and negatively impact ONDO. In such a case, the RWA-based token could not only slip below $0.633 but crash 31% lower and retest the $0.433 support floor.
Author

Akash Girimath
FXStreet
Akash Girimath is a Mechanical Engineer interested in the chaos of the financial markets. Trying to make sense of this convoluted yet fascinating space, he switched his engineering job to become a crypto reporter and analyst.




