OMG Network price is ready for a pullback as technicals scream sell
- OMG Network price hit an intraday high at $3.83 but failed to hold the ground.
- Despite the retreat, the coin has gained over 6% on a day-to-day basis and over 30% week-to-week.

OMG Network is the 37th largest digital coin with a current market capitalization of $500 billion and an averaged daily trading volume of $353 million. It is most actively traded on Binance and Huobi Global. Several indicators show that OMG is poised for a pullback in the short-term as the digital asset hits a robust resistance level on the way up.
OMG looks poised for a retrace according to various indicators
On the 6-hour chart, the TD Sequential indicator has just presented a sell signal. The past three sell signals given by this indicator had significant bearish follow-through, indicating a high chance that the last call will also drive OMG Network price down.
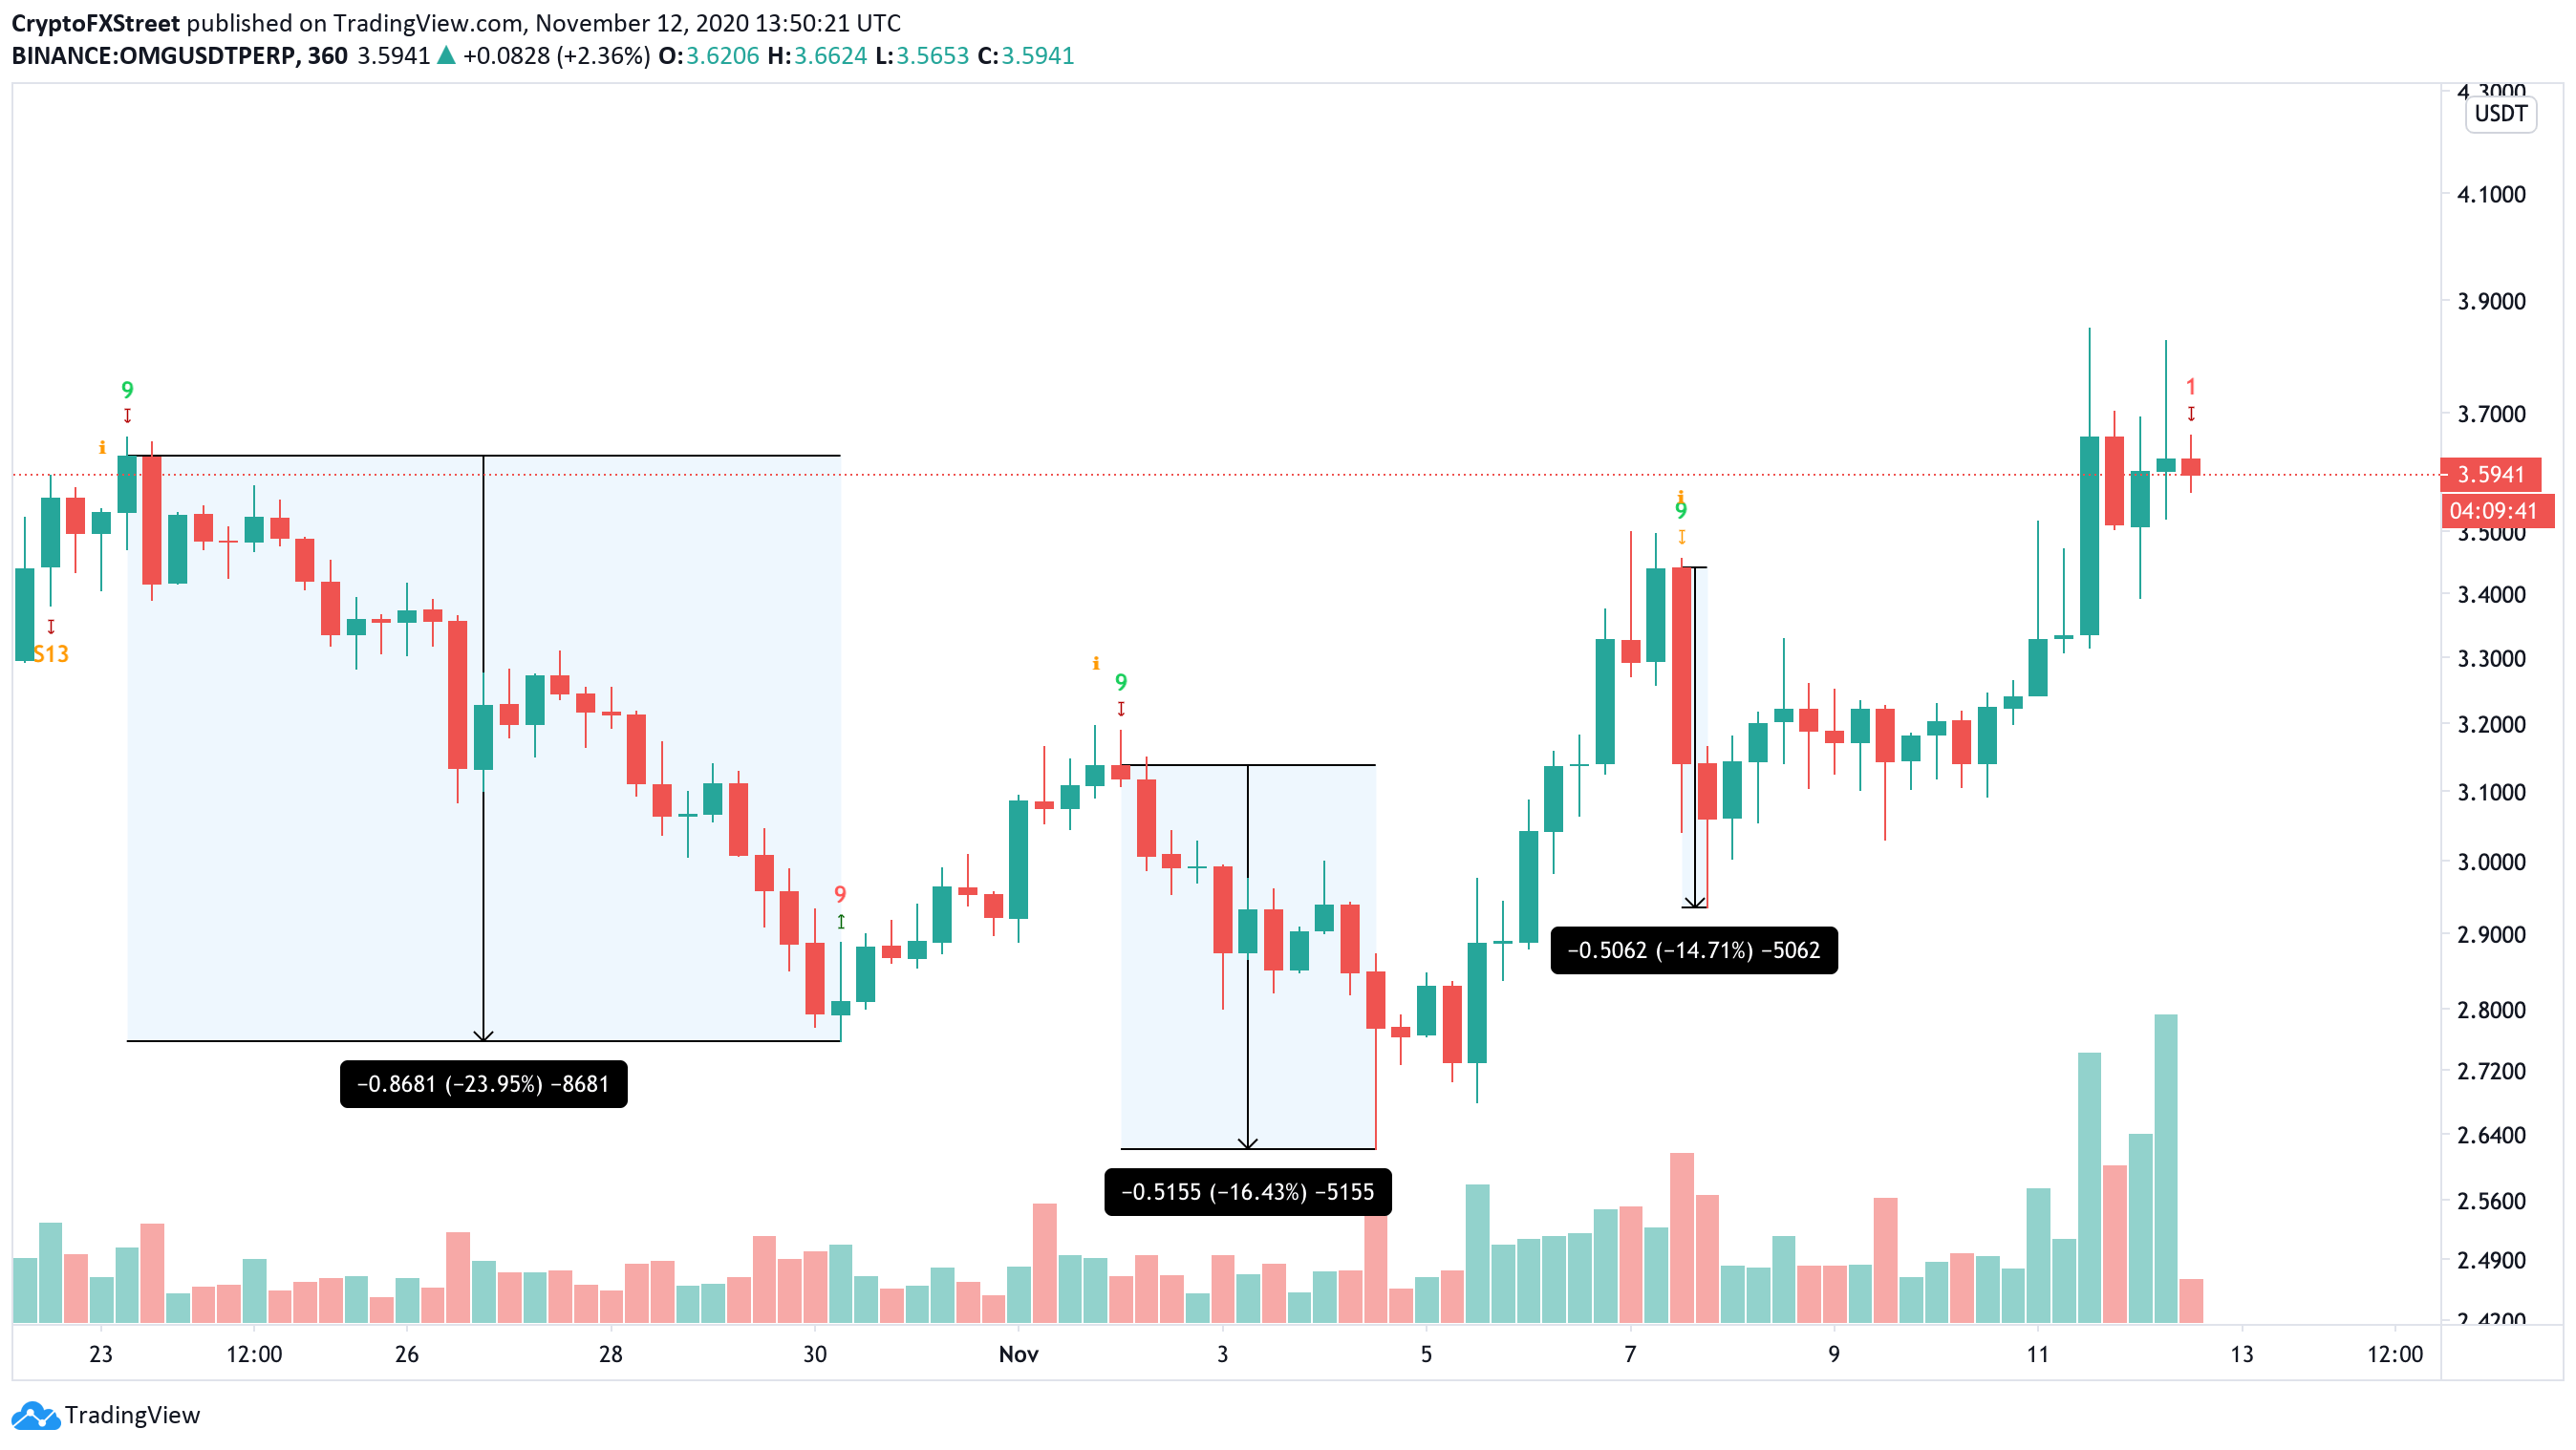
OMG/USD 6-hour chart
The In/Out of the Money Around Price (IOMAP) chart shows that the next significant support level sits around $3.4. A breakdown from this point could drive OMG Network price to $3.1 according to the IOMAP chart. On the daily chart, OMG seems to have established a descending parallel channel.
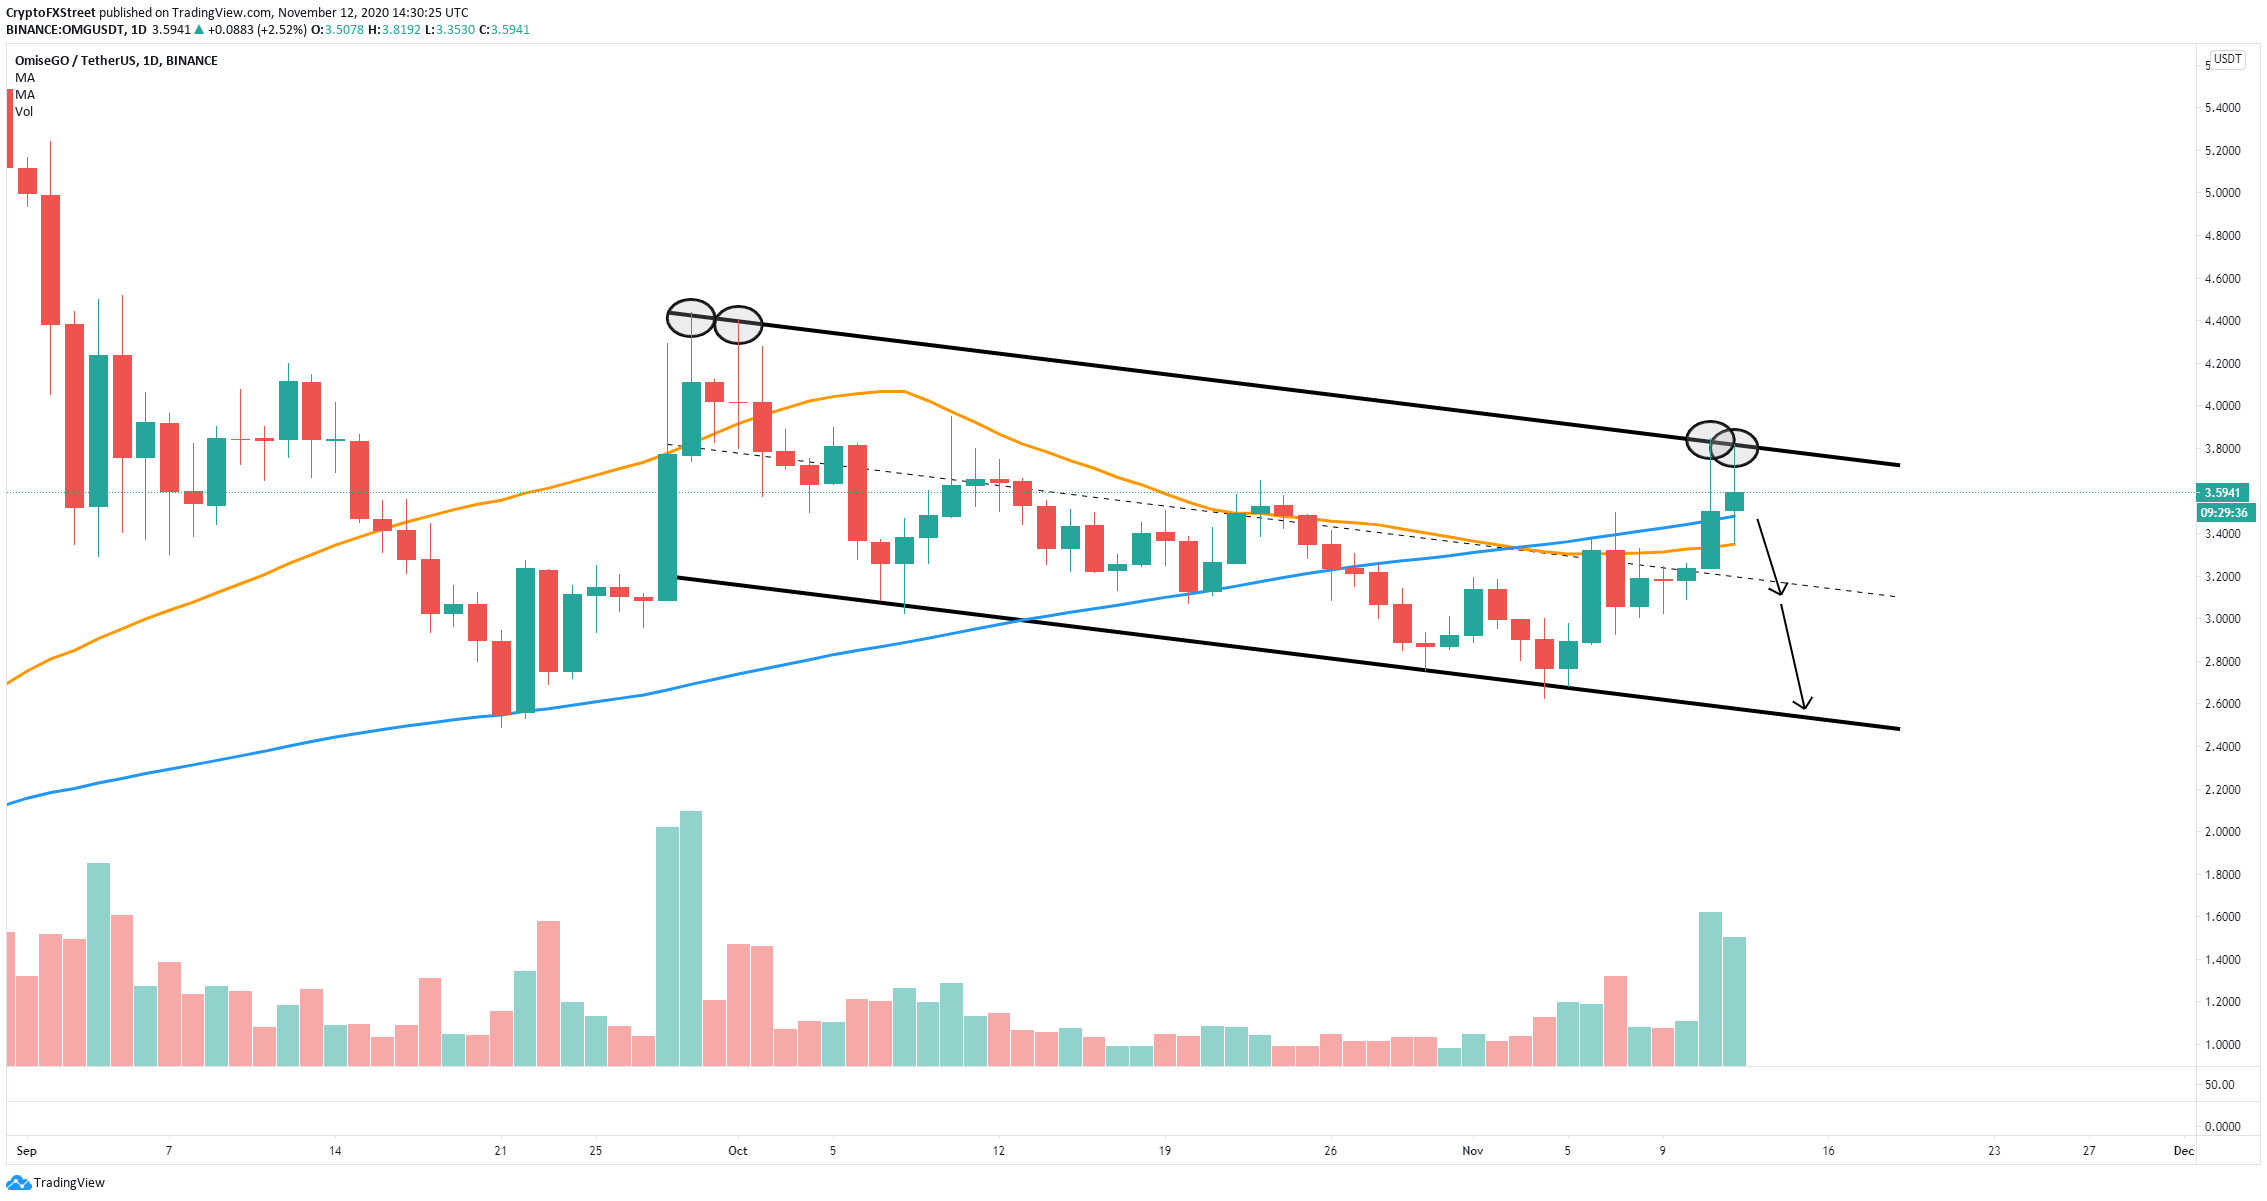
OMG/USD daily chart
The upper trendline at $3.8 is acting as a strong resistance level, rejecting the price twice in the past 48 hours. The 100-SMA and 50-SMA coincide around the healthy support level at around $3.4, adding more strength to the theory that a breakdown from this point would lead to a decline in OMG Network price towards $3.1 and as low as $2.6 in the longer-term, the lower boundary of the pattern.
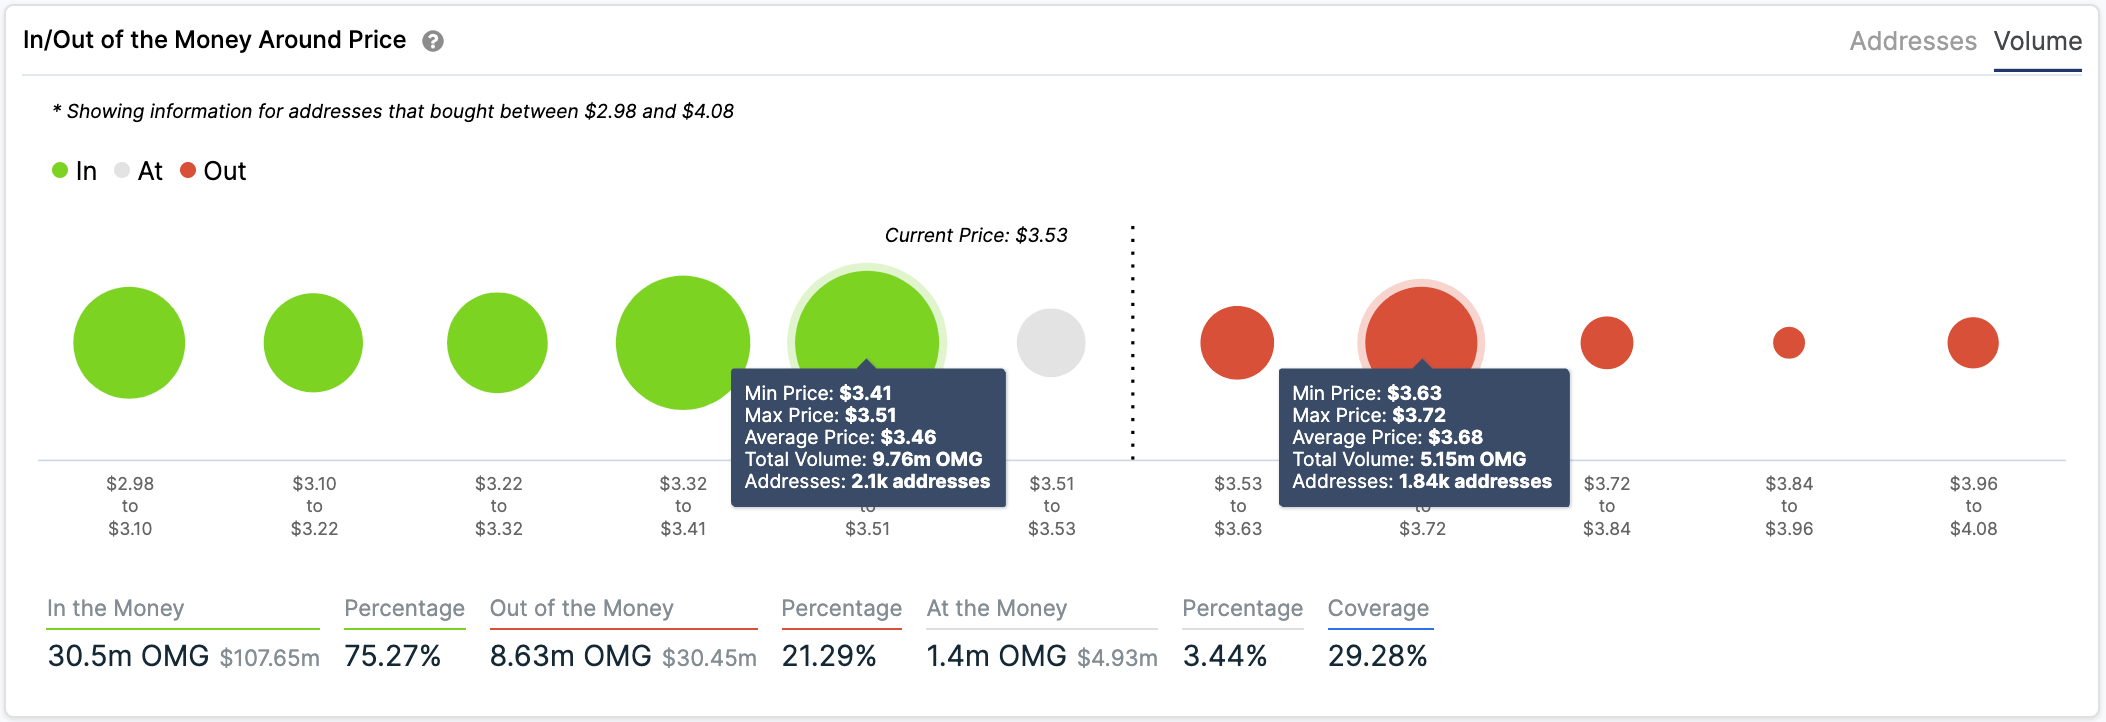
OMG IOMAP chart
However, the same IOMAP chart also shows only one significant resistance area between $3.63 and $3.72. Over 1,750 addresses holding nearly 6 million coins create a local resistance here. It seems that a breakout above this point could quickly drive OMG Network price to $4.
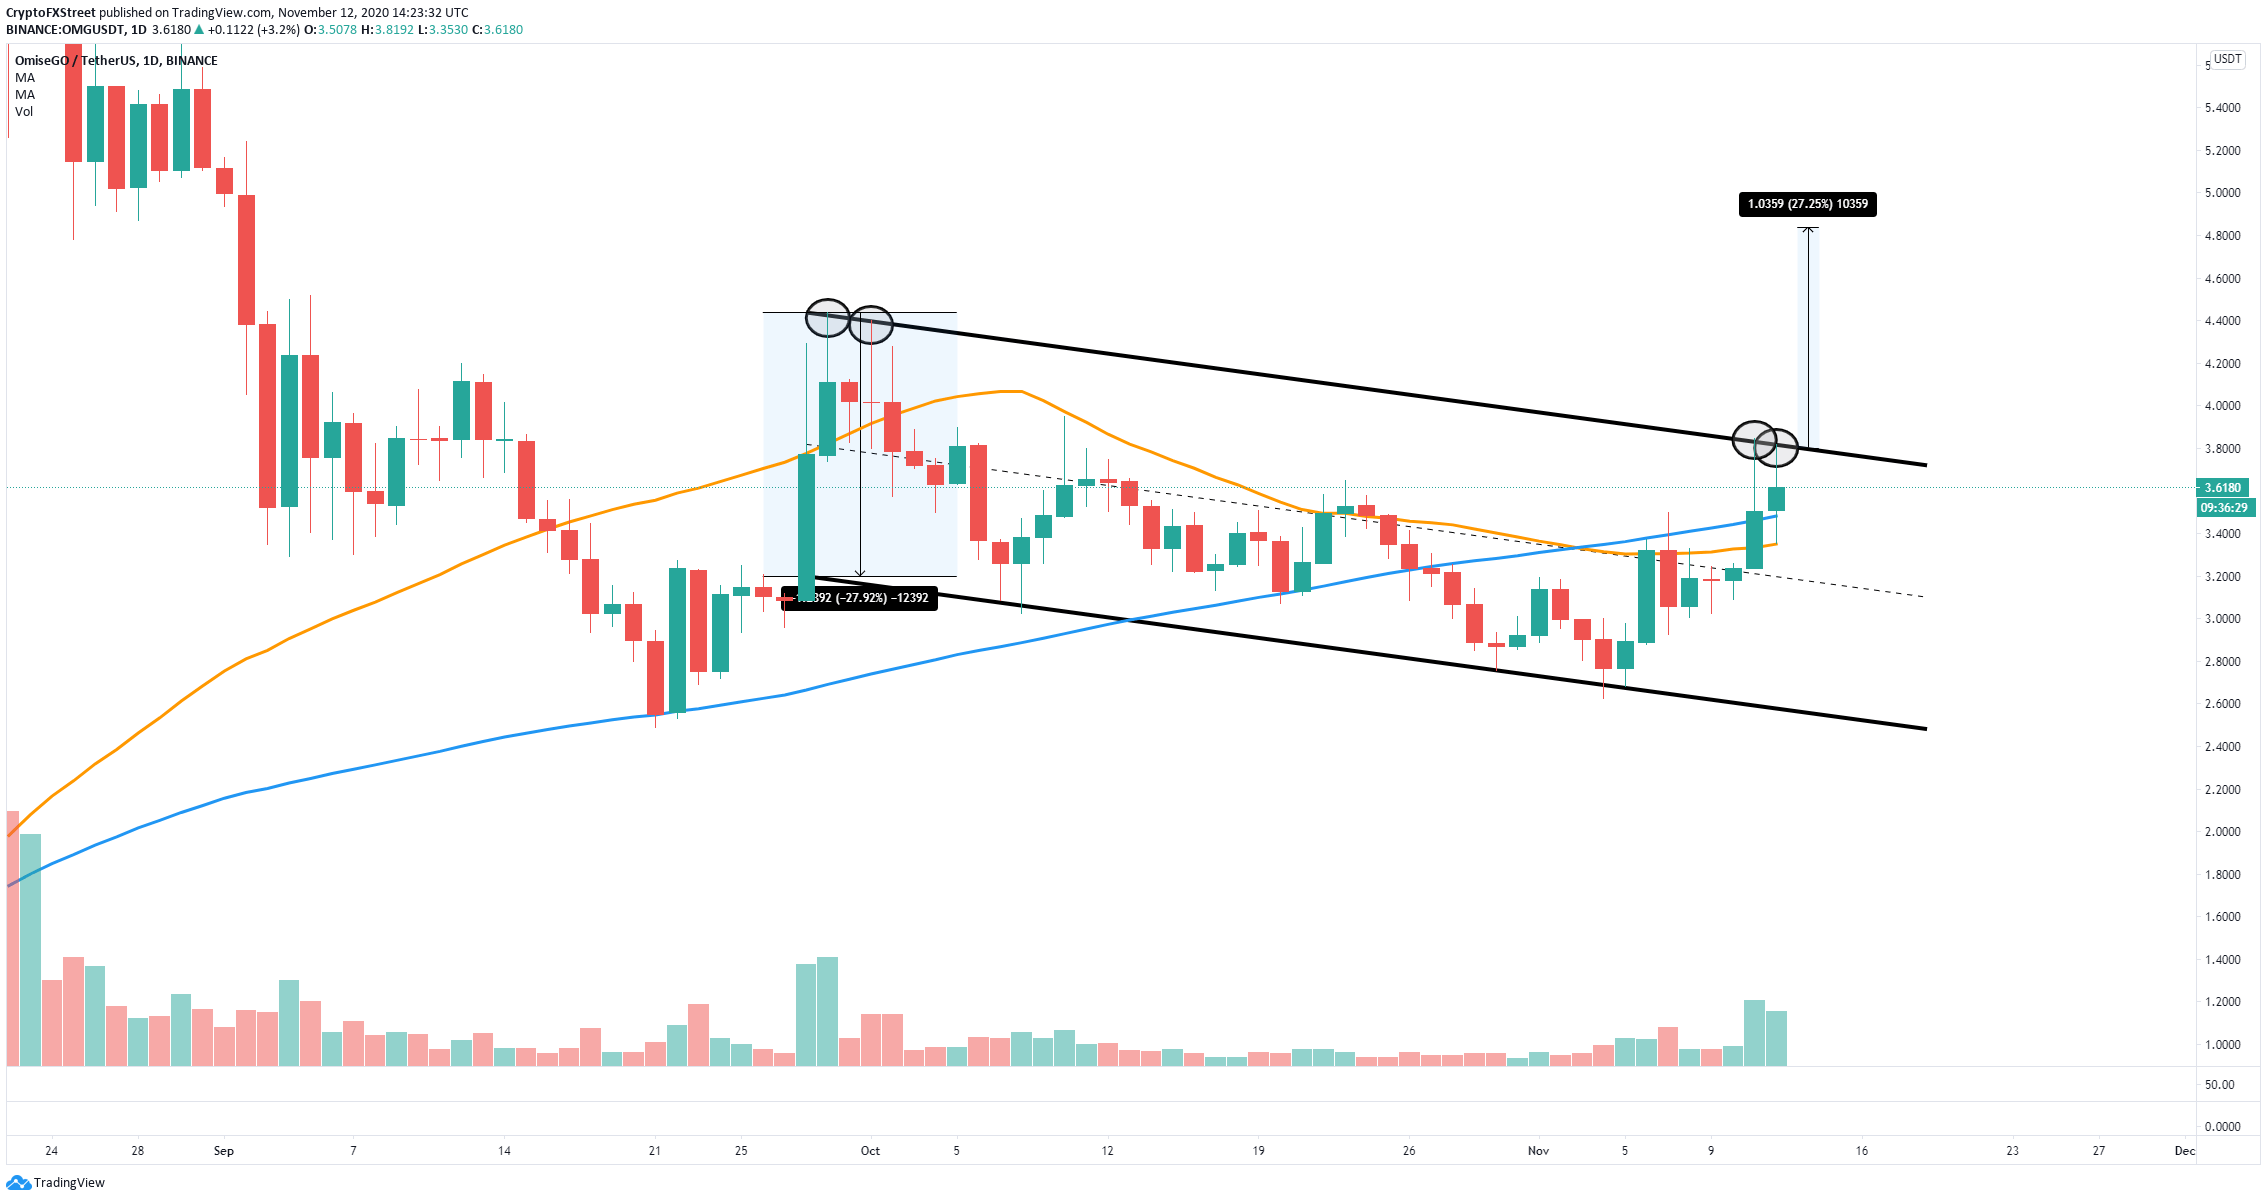
OMG/USD daily chart
A breakout would also mean climbing above the upper trendline of the descending parallel channel on the daily chart, adding more strength to the move, and targeting $4.8 in the long-term using the height of the pattern as a reference point.
Author

Lorenzo Stroe
Independent Analyst
Lorenzo is an experienced Technical Analyst and Content Writer who has been working in the cryptocurrency industry since 2012. He also has a passion for trading.


