OMG Network Price Forecast: OMG holds firmly to critical support as buying pressure builds
- OMG Network bulls are building momentum upon the crucial support at the 50 SMA.
- A breakout to $5 could materialize if OMG/USD pierces through the resistance at $3.2.

OMG Network made a remarkable recovery from the lows in March to the yearly highs of $9.9, achieved in August. Despite the month-over-month gains, bears swung into action, hence the losses under the descending trendline.
The declines became unstoppable until OMG/USD recently embraced support at the 50 Simple Moving Average (SMA) on the 3-day chart. At the moment, OMG is looking forward to massive price action amid growing buying pressure.
OMG prepares for a massive liftoff
The value transfer token is changing hands at $2.8 at the time of writing. OMG is ranked 35th in the market and boasts of $391 billion in market capitalization. The token has attracted a 24-hour trading volume of $423 million.
OMG Network’s immediate downside is supported by the 50 SMA, as mentioned earlier. If this buyer congestion zone continues to hold, prices may rebound to $3.2. Breaking above this critical seller congestion zone could catapult the token above the descending trendline. OMG’s bullish outlook will then be validated with prices setting up for a 50% rally to levels around $5.
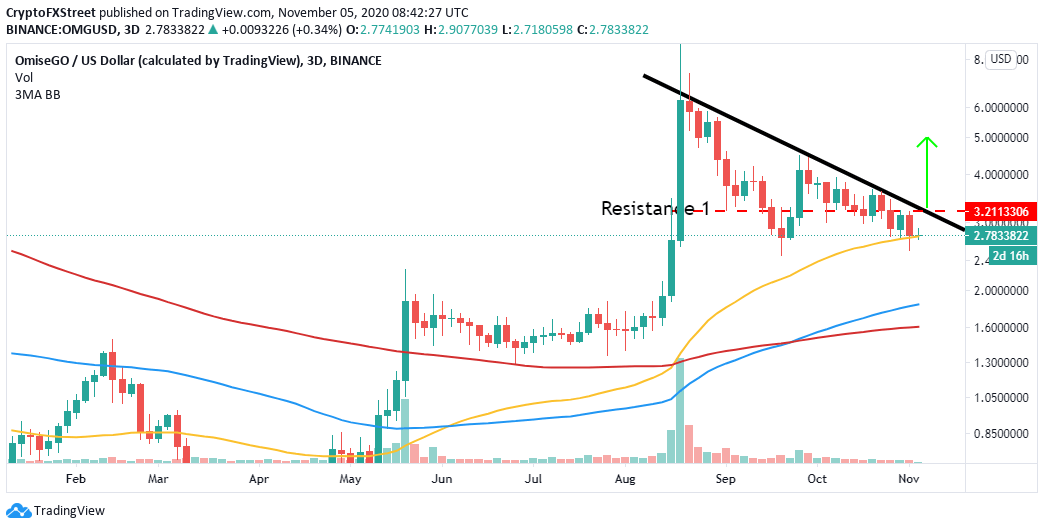
OMG/USD 3-day chart
The Relative Strength Index (RSI) adds credibility to the bullish outlook – take a look at the divergence formed since October 20 between OMG price and the RSI.
It is worth stating that the bullish divergences mainly occur when an asset price makes a lower low pattern, while the RSI makes a high low pattern. In this case, the technical pattern does not provide an exact entry point for buy orders; instead, it highlights that the medium-long downtrend may be approaching exhaustion.
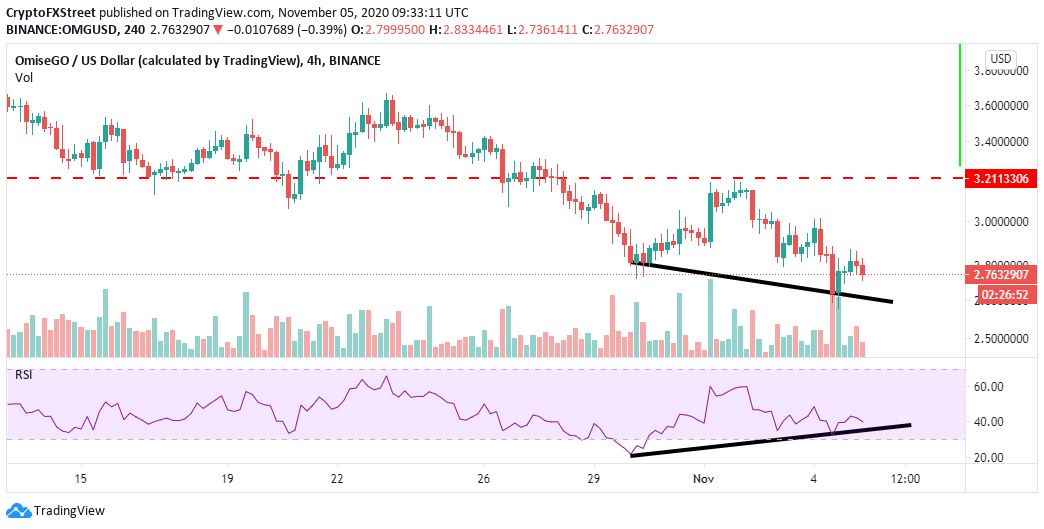
OMG/USD 4-hour chart
On the downside, the bearish outlook will be invalidated if the 50 SMA support on the 3-day chart is broken. The declines that might ensue will likely pull OMG Network to the tentative support at the 200 SMA in the same timeframe.
-637401656970545949.png)
OMG Network IOMAP chart
The IOMAP model by IntoTheBlock discredits the technical optimism after revealing strong resistances ahead of OMG. If bulls manage to overcome the seller congestion at $2.8 and $2.9, it is uncertain that they will slice through the next crucial resistance.
A massive seller congestion range lies between $2.96 and $3. Here, nearly 1,400 addresses had previously bought around 5.4 million OMG. On the flip side, the lack of a formidable suggests that OMG might breakdown to $2.5.
Author

John Isige
FXStreet
John Isige is a seasoned cryptocurrency journalist and markets analyst committed to delivering high-quality, actionable insights tailored to traders, investors, and crypto enthusiasts. He enjoys deep dives into emerging Web3 tren


