NULS price eyes a pullback despite a flurry of DeFi developments
- PancakeSwap’s Syrup pool has accepted NULS to provide investors with a 2,590% APY.
- Users can earn rewards via staking as NULS project collaborates with Biscuit Farm Finance
- Regardless of the development, NULS price hints at a correction in the short term.

NULS project has announced multiple collaborations with DeFi projects and the launch of liquidity pools over the last few days. Despite the significance of the announcements, NULS price suggests that a drop could be underway.
PancakeSwap and Biscuit Farm Finance adopt NULS
NULS project, well-known for its Staked Coin Output (SCO) innovation, has been accepted into PancakeSwap’s Syrup pool. Users can now earn 150,000 NULS, worth roughly $123,000, by staking CAKE over a 60 day period starting on March 11.
As an update to this development, yield optimizer Beefy Finance launched a NULS liquidity pool vault from PancakeSwap for the NULS-BUSD pair. Investors will be able to receive a whopping 2,590% annualized percentage yield by providing liquidity.
In another update, NULS recently collaborated with Biscuit Farm Finance and Nerve Network to help the newly launched projects raise capital. In this regard, the number of projects on NULS’s SCO platform has doubled in the last month.
All-in-all, NULS has a highly active presence in the DeFi community, which has helped propel its price by 142% between February 28 and March 12.
Now, the altcoin shows signs of exhaustion and could pull back in the near term.
NULS price primed to retrace
NULS price formed a local top around $0.80 area on February 14. Since then, the token corrected approximately 45% before surging higher. Nonetheless, NULS has failed to stay above the Momentum Reversal Indicator’s (MRI) breakout line around the $0.92 level.
Hence, the recent swing high at $1.08 could face a similar outcome as the previous one.
If this were to happen, then NULS price could retrace a minimum of 10% to an immediate demand barrier at $0.744, which coincides with the short-length exponential moving average (EMA) on the daily chart.
Adding credence to this bearish outlook is the Moving Average Convergence Divergence (MACD) indicator. This metric paints a looming bearish picture as the MACD line is declining towards the signal line, hinting at a bearish crossover.
If these events come to fruition, NULS price will be in trouble.
A spike in selling pressure around the current levels could push the token down to the 61.8% Fibonacci retracement level at $0.55, representing a 34% correction and could coincide with the long-length EMA’s projection.
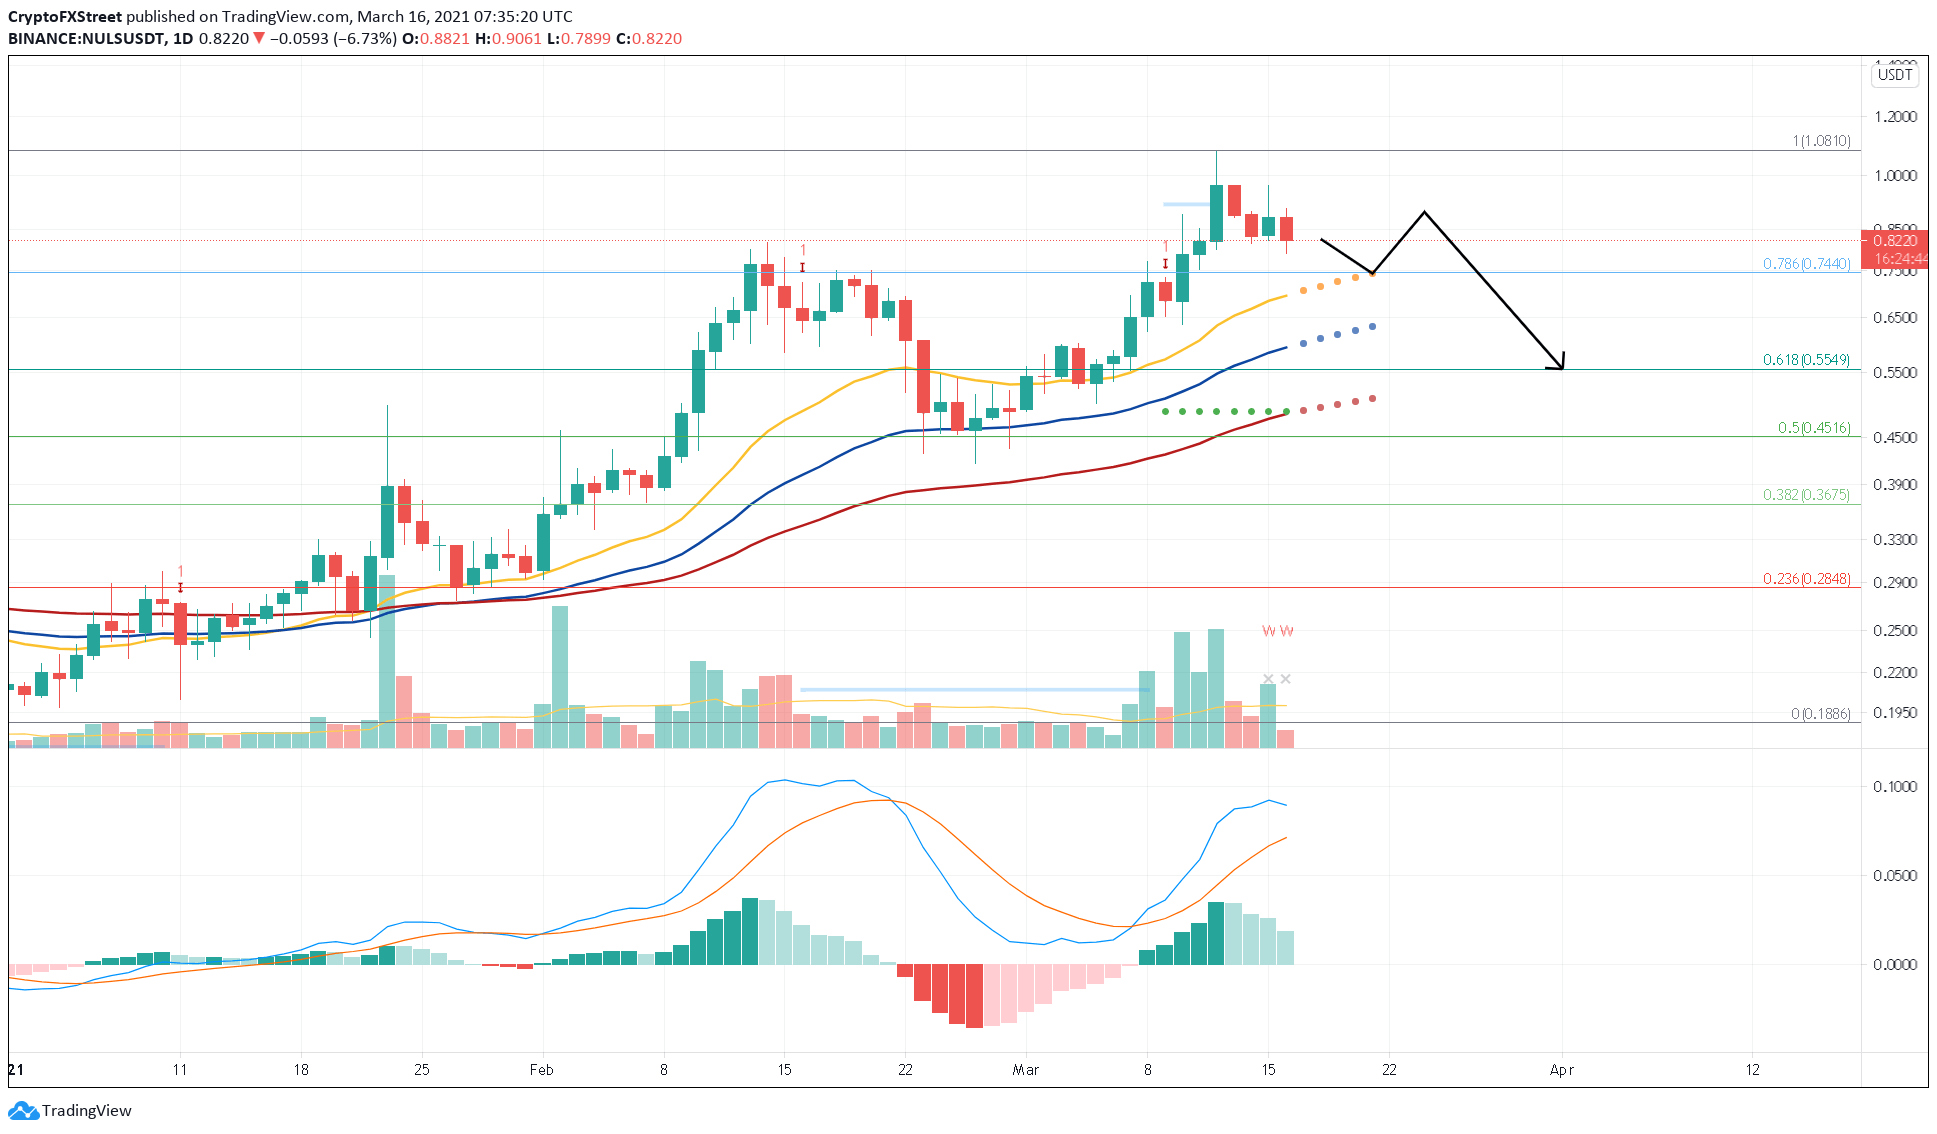
NULS/USDT 1-day chart
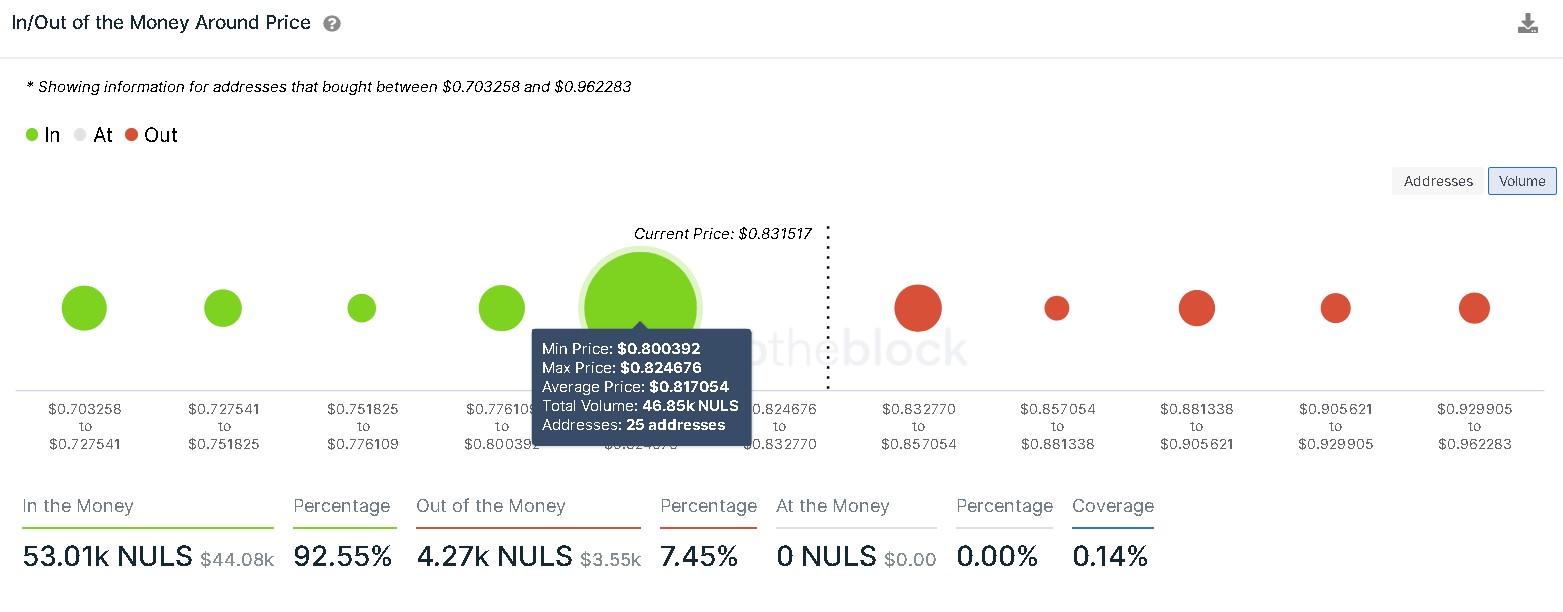
Regardless of the bearish outlook, IntoTheBlock’s In/Out of the Money Around Price (IOMAP) model shows a stable demand barrier at $0.81. Here roughly 25 addresses have purchased nearly 46,850 NULS tokens. This important area of interest might absorb any short-term bearish pressure.
Therefore, investors can expect a potential bounce from three levels as NULS price goes down. The $0.81 support, the mid-length EMA at $0.62, or the long-length EMA at $0.51.
NULS IOMAP chart
Either way, a daily candlestick close above the breakout line at $0.92 could invalidate the bearish thesis. Moving past this barrier could lead to an upswing towards $1.08, which will act as a secondary confirmation of the bullish outlook.
If this were to happen, NULS price could then rise to $1.73 or the 127.2% Fibonacci retracement level.
Author

Akash Girimath
FXStreet
Akash Girimath is a Mechanical Engineer interested in the chaos of the financial markets. Trying to make sense of this convoluted yet fascinating space, he switched his engineering job to become a crypto reporter and analyst.




