Three must-know crypto bull rally facts and how to be profitable as a trader
- Crypto markets are characterized by phases of expansion and contraction, and these phases tend to repeat.
- Uptrending markets move in a rally-base-rally format, or when a rally is followed by consolidation, which results in another rally.
- Downtrending markets follow a similar pattern of drop-base-drop.
- On both sides, the consolidation phase is usually characterized by liquidity runs below key levels.

The cryptocurrency market seems to be extending the 2023 bull market after October’s impressive run-up. The ongoing north-bound move in crypto prices offers countless opportunities for crypto traders, but it isn’t free from volatility. History and technical indicators can be useful to get cues about how the market behaves, likely giving hints to increase profitability.
Bitcoin (BTC) price kick-started its uptrend at the start of 2023 and has returned 120% year-to-date gains. Some altcoins like Solana (SOL) have yielded a whopping 342% returns for investors in the same period. While this rally is impressive, it has shocked many investors who are still sidelined and are waiting for dips to enter. These investors are likely to remain sidelined because there is a stark contrast between how crypto markets trade during a bear market and a bull market.
Read more: SEC’s Gensler hints he’s open to a FTX reboot under proper leadership: Report
Crypto ETF FAQs
What is an ETF?
An Exchange-Traded Fund (ETF) is an investment vehicle or an index that tracks the price of an underlying asset. ETFs can not only track a single asset, but a group of assets and sectors. For example, a Bitcoin ETF tracks Bitcoin’s price. ETF is a tool used by investors to gain exposure to a certain asset.
Is Bitcoin futures ETF approved?
Yes. The first Bitcoin futures ETF in the US was approved by the US Securities & Exchange Commission in October 2021. A total of seven Bitcoin futures ETFs have been approved, with more than 20 still waiting for the regulator’s permission. The SEC says that the cryptocurrency industry is new and subject to manipulation, which is why it has been delaying crypto-related futures ETFs for the last few years.
Is Bitcoin spot ETF approved?
Bitcoin spot ETF has been approved outside the US, but the SEC is yet to approve one in the country. After BlackRock filed for a Bitcoin spot ETF on June 15, the interest surrounding crypto ETFs has been renewed. Grayscale – whose application for a Bitcoin spot ETF was initially rejected by the SEC – got a victory in court, forcing the US regulator to review its proposal again. The SEC’s loss in this lawsuit has fueled hopes that a Bitcoin spot ETF might be approved by the end of the year.
Crypto winter against bull market facts
In early November 2021, Bitcoin (BTC) price reached an all-time high of $69,000. But the uptrend that pushed BTC higher was a set of higher highs and higher lows. Typically, a bull run consists of a rally followed by a consolidation or base formation, which serves as a take-off point for the next rally. Ideally, an uptrend is characterized by rally-base-rally. During the base formation, there might be pullbacks to key support levels or liquidity pools.
Liquidity pools are swing points where investors generally place their stops. A liquidity run denotes a sweep of these stop orders.
Bitcoin’s bullish market structure was broken by mid-November 2021, creating a lower low and lower high. This move signaled the start of a downtrend, but many investors were in disbelief and were caught in the wrong direction of the upcoming moves.
Like the uptrend, the bear market is characterized by a drop-base-drop with the base including retracements to key support levels or liquidity pools.
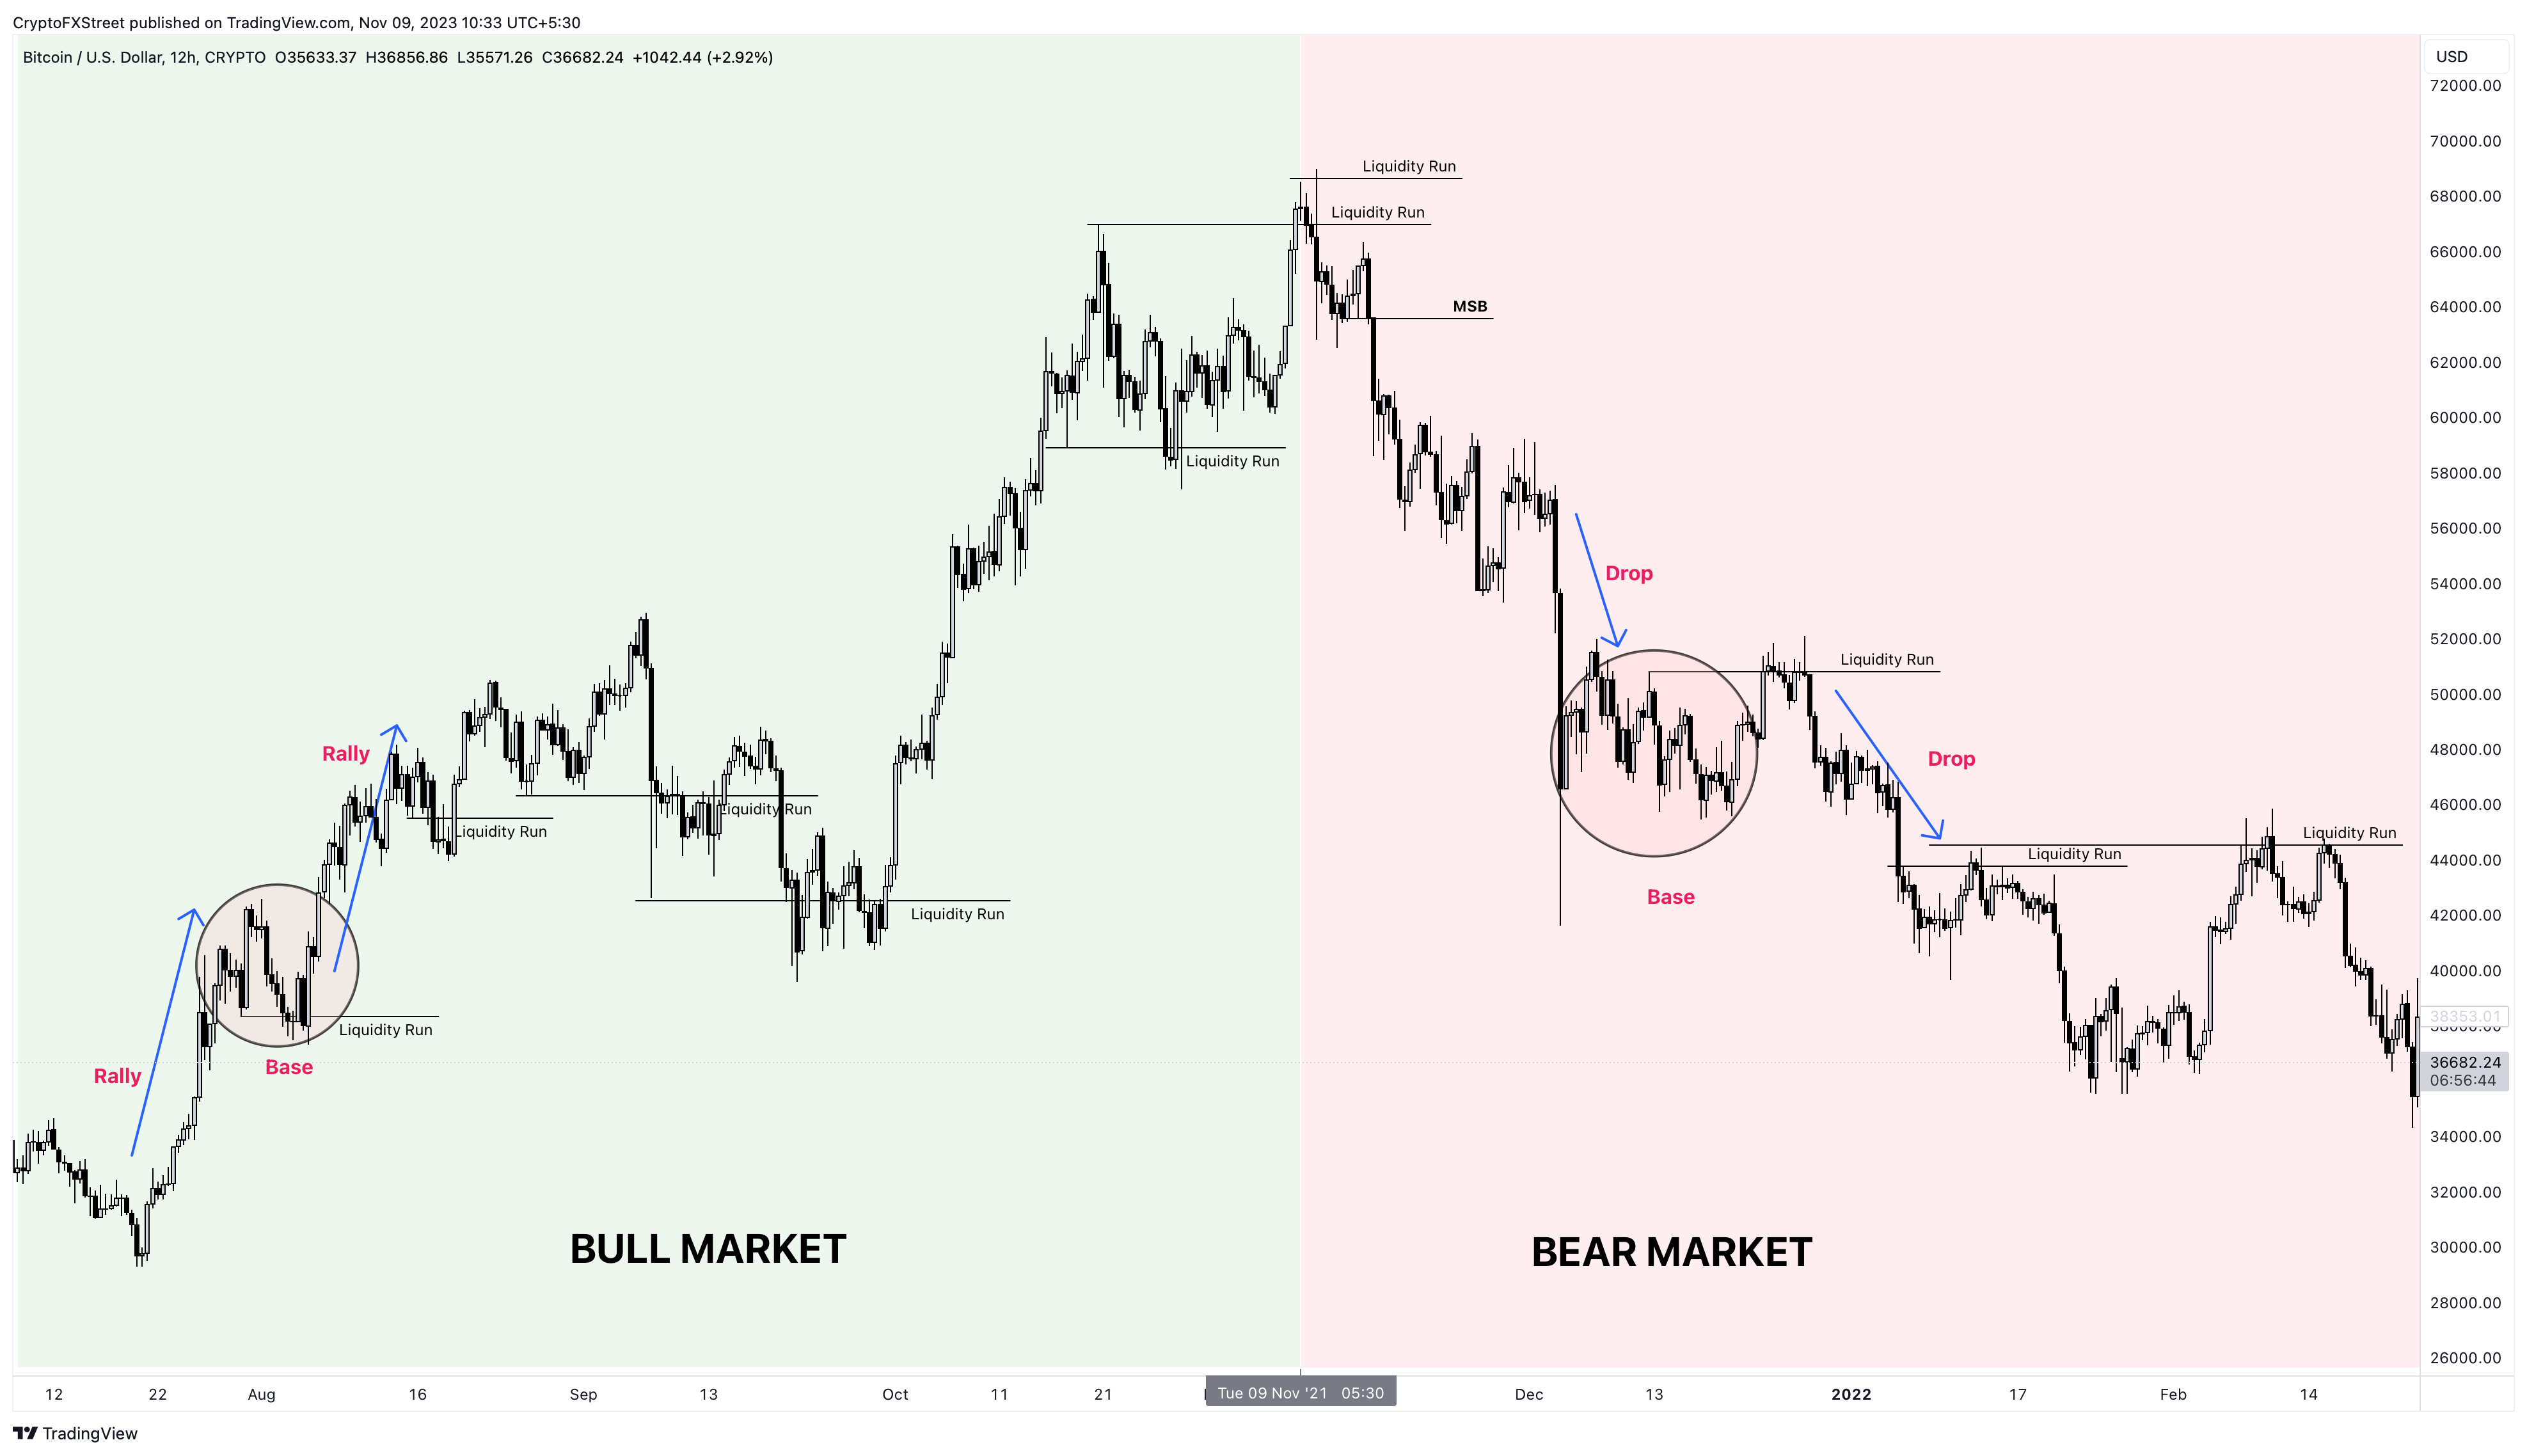
BTC/USD 12-hour chart
Read more: Gary Gensler decries crypto industry after Sam Bankman-Fried conviction
Understanding coin-specific trends
Leverage-trading cryptocurrencies is hard due to crypto’s volatility, which only increases the chances of getting liquidated or stopped out.
Here are a few examples of how to find altcoin-specific trends.
STORJ price rallies nearly 60% in less than two days
Storj (STORJ) price has consistently stuck to the rally-base-rally structure with liquidity runs happening inside the base, also known as the consolidation phase. A lower time frame analysis after liquidity runs on 4-hour time frames would give traders a better entry before the explosion phase.
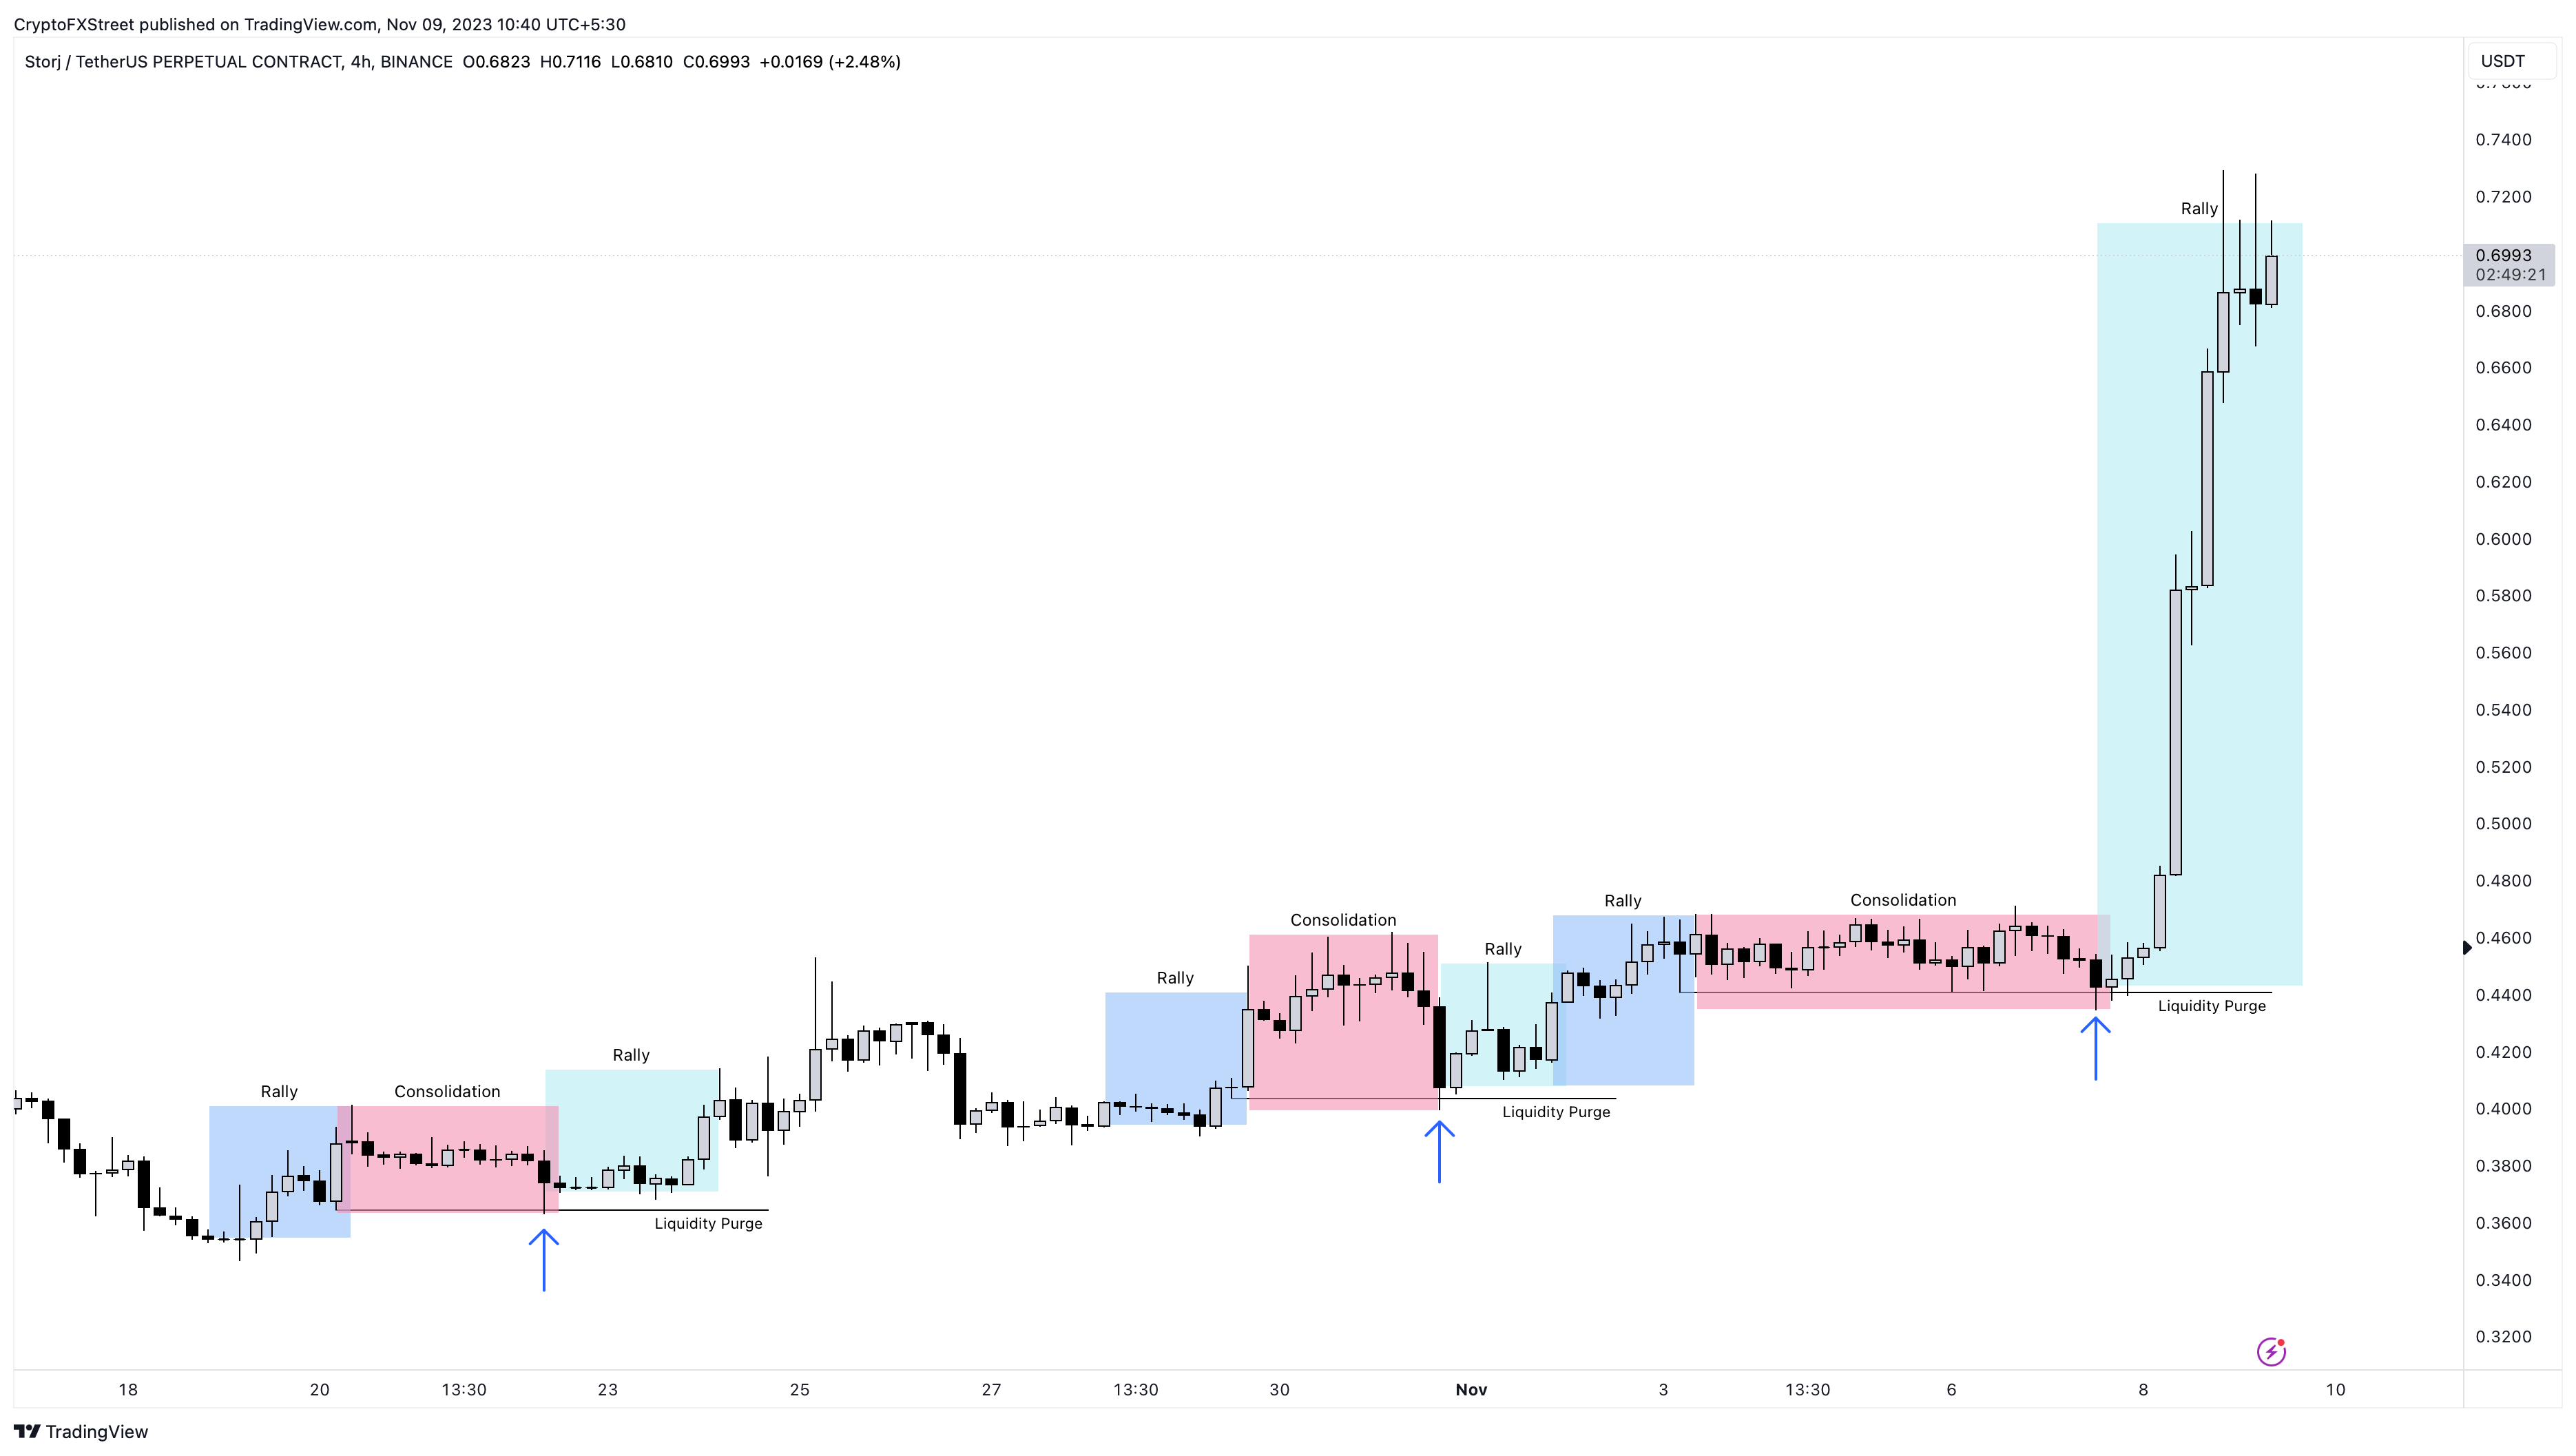
STORJ/USDT 4-hour chart
While STORJ moves followed the rally-base-rally structure, other altcoins might not. Hence, it is important to identify the ongoing trend for each coin. Ideally, this can be done by observing past price action.
Additionally, investors can also use momentum indicators and liquidity runs as signals before the start of a rally.
Another example is Uniswap’s UNI token on the 15-minute time frame.
UNI price swept sell stops resting below October 31 lows on November 1. After the liquidity run, Uniswap price immediately reversed, which led to the flip of the 15-minute Relative Strength Index (RSI) above the 50 mean level. Soon thereafter, the Awesome Oscillator (AO) also flipped above the zero line, signaling a shift in momentum. Interestingly, the token also produced a Market Structure Break (MSB), confirming the start of an uptrend.
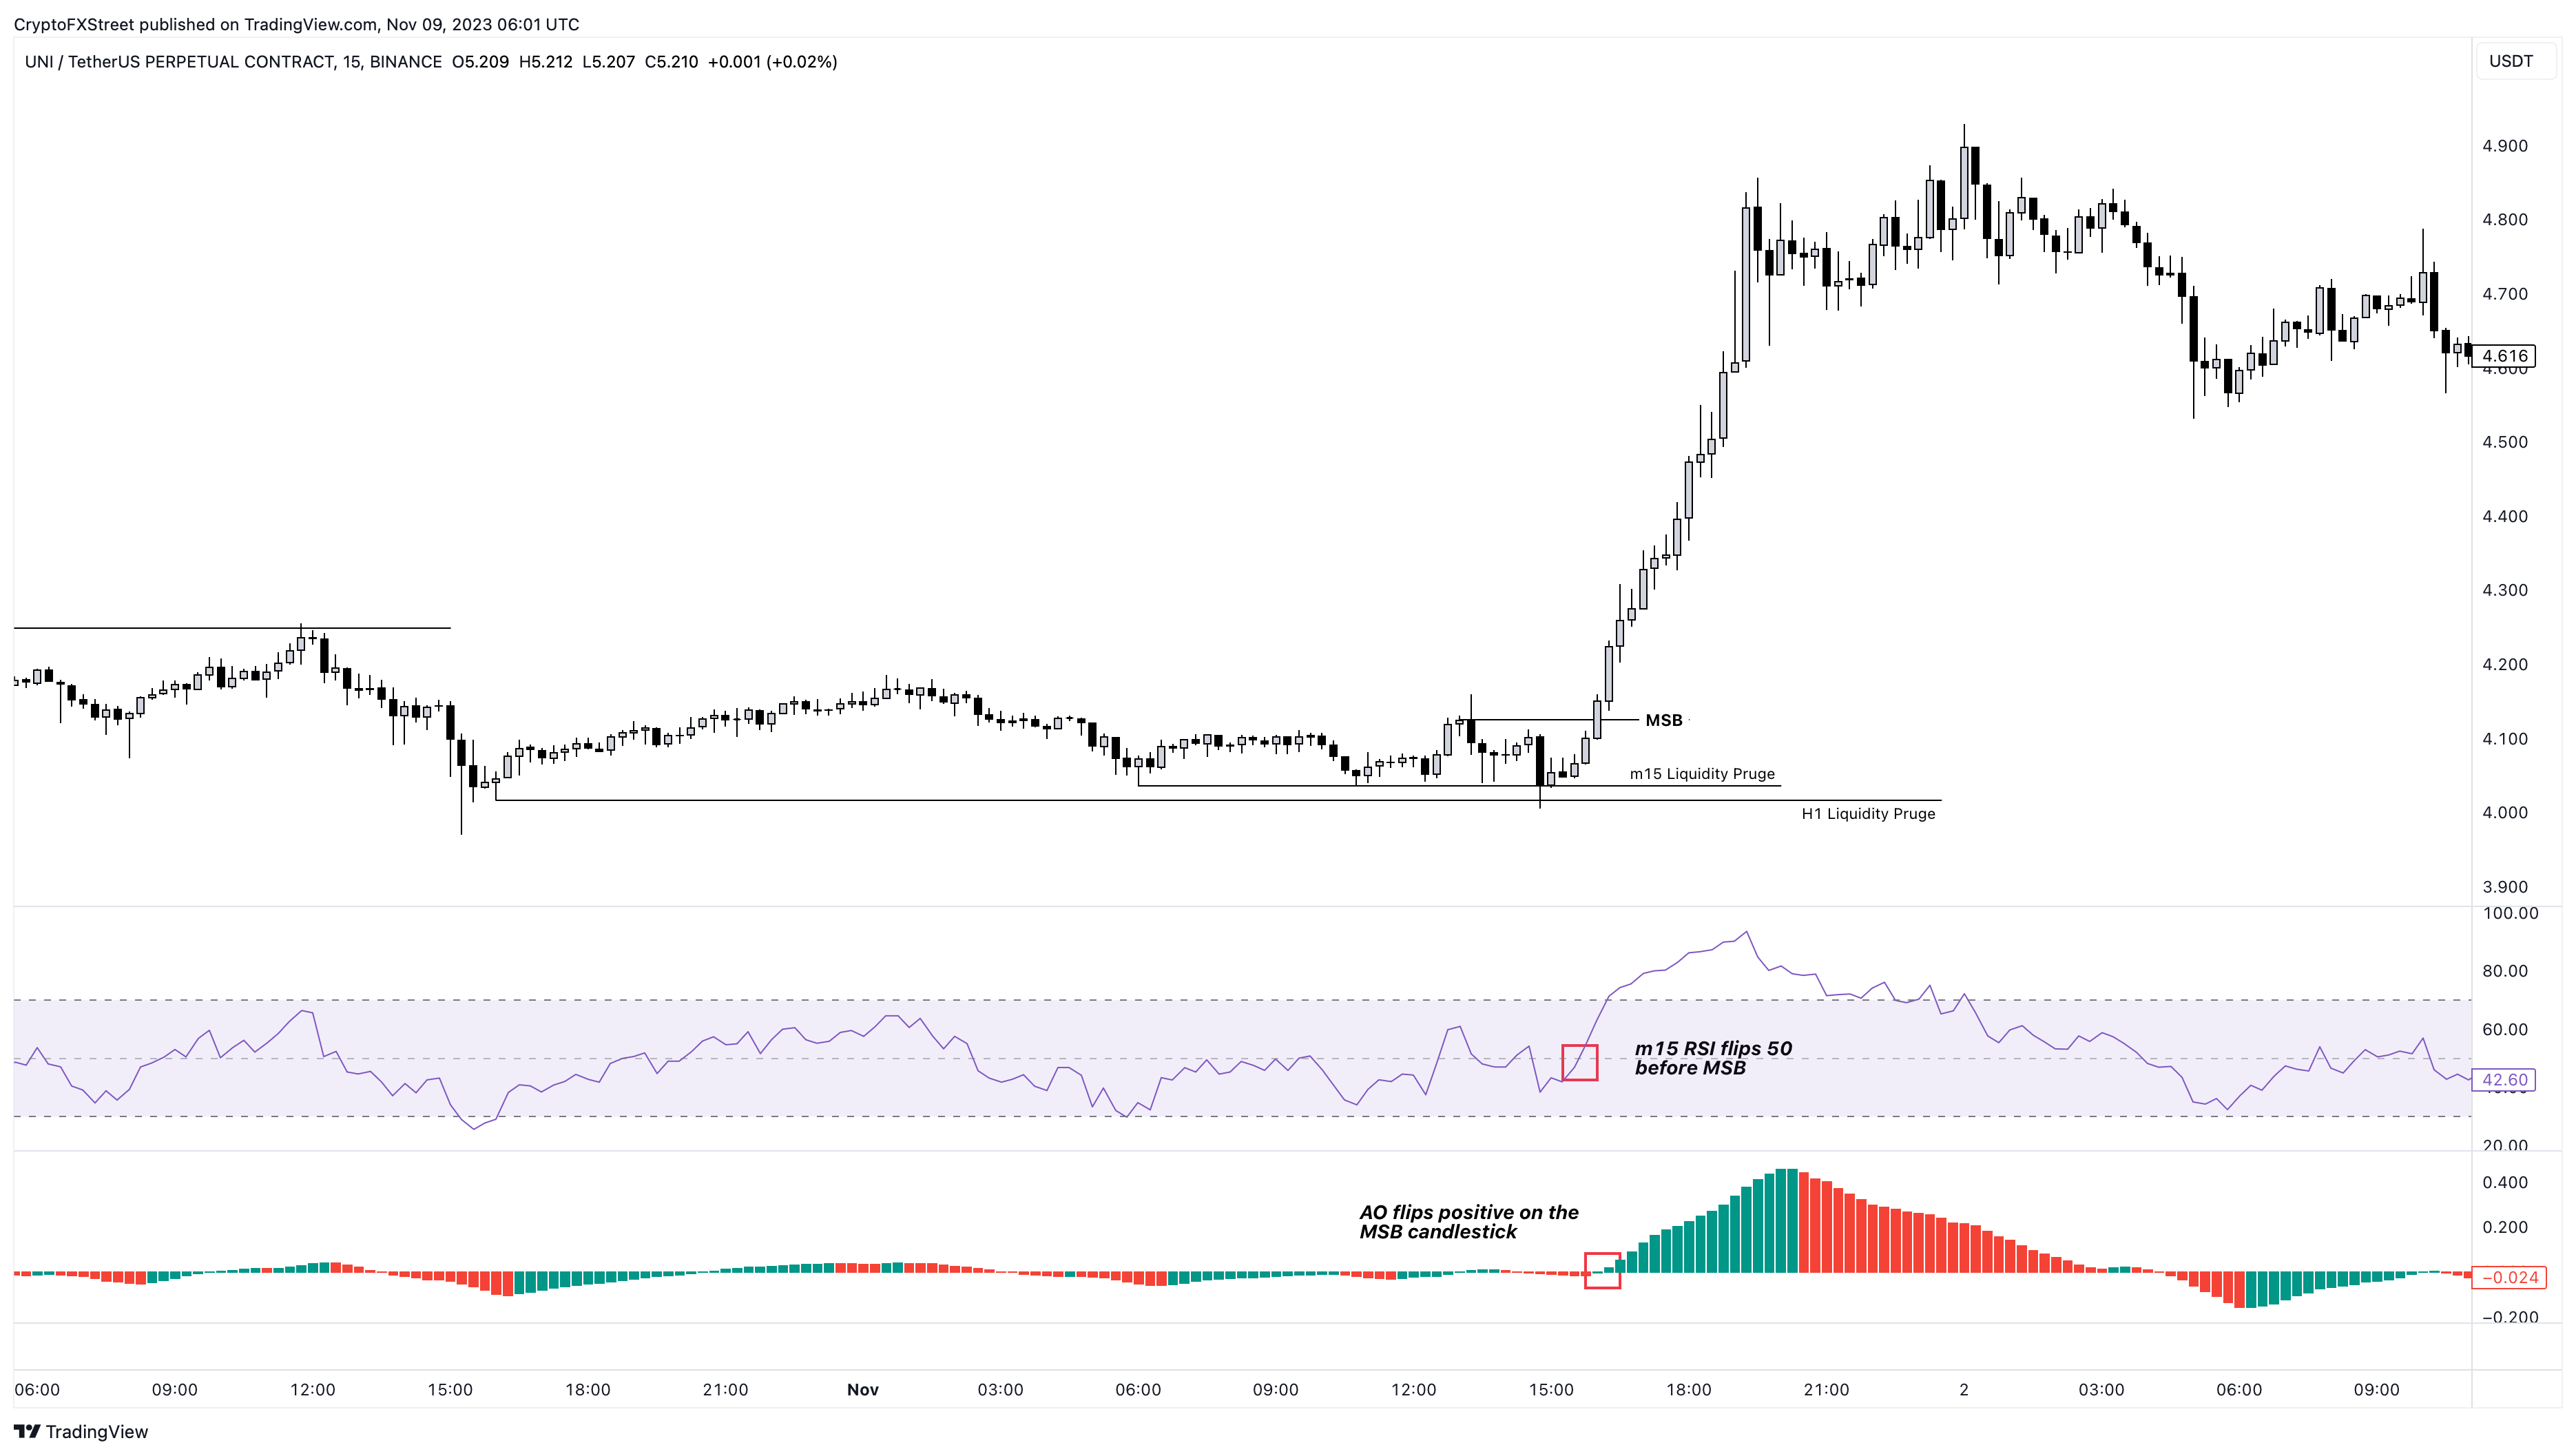
UNI/USDT 15-minute chart
Positioning before the rally
On October 31, LDO price swept the October 27 swing low for sell-side liquidity, triggering a 6% rally. A similar uptick was noted after a liquidity run on November 1. But the events that unfolded between November 2 and 4 are good examples of how to position in a bullish trade.
On November 3, LidoDAO price swept the previous day’s low and initiated a quick recovery. After nearly twelve hours from the point of liquidity run, LDO produced a higher high, signaling a market structure break. Four hours after this move, LidoDAO price pulled back, providing a chance to enter a long trade.
Following this quick retracement, LDO rallied nearly 15% in the next 16 hours.
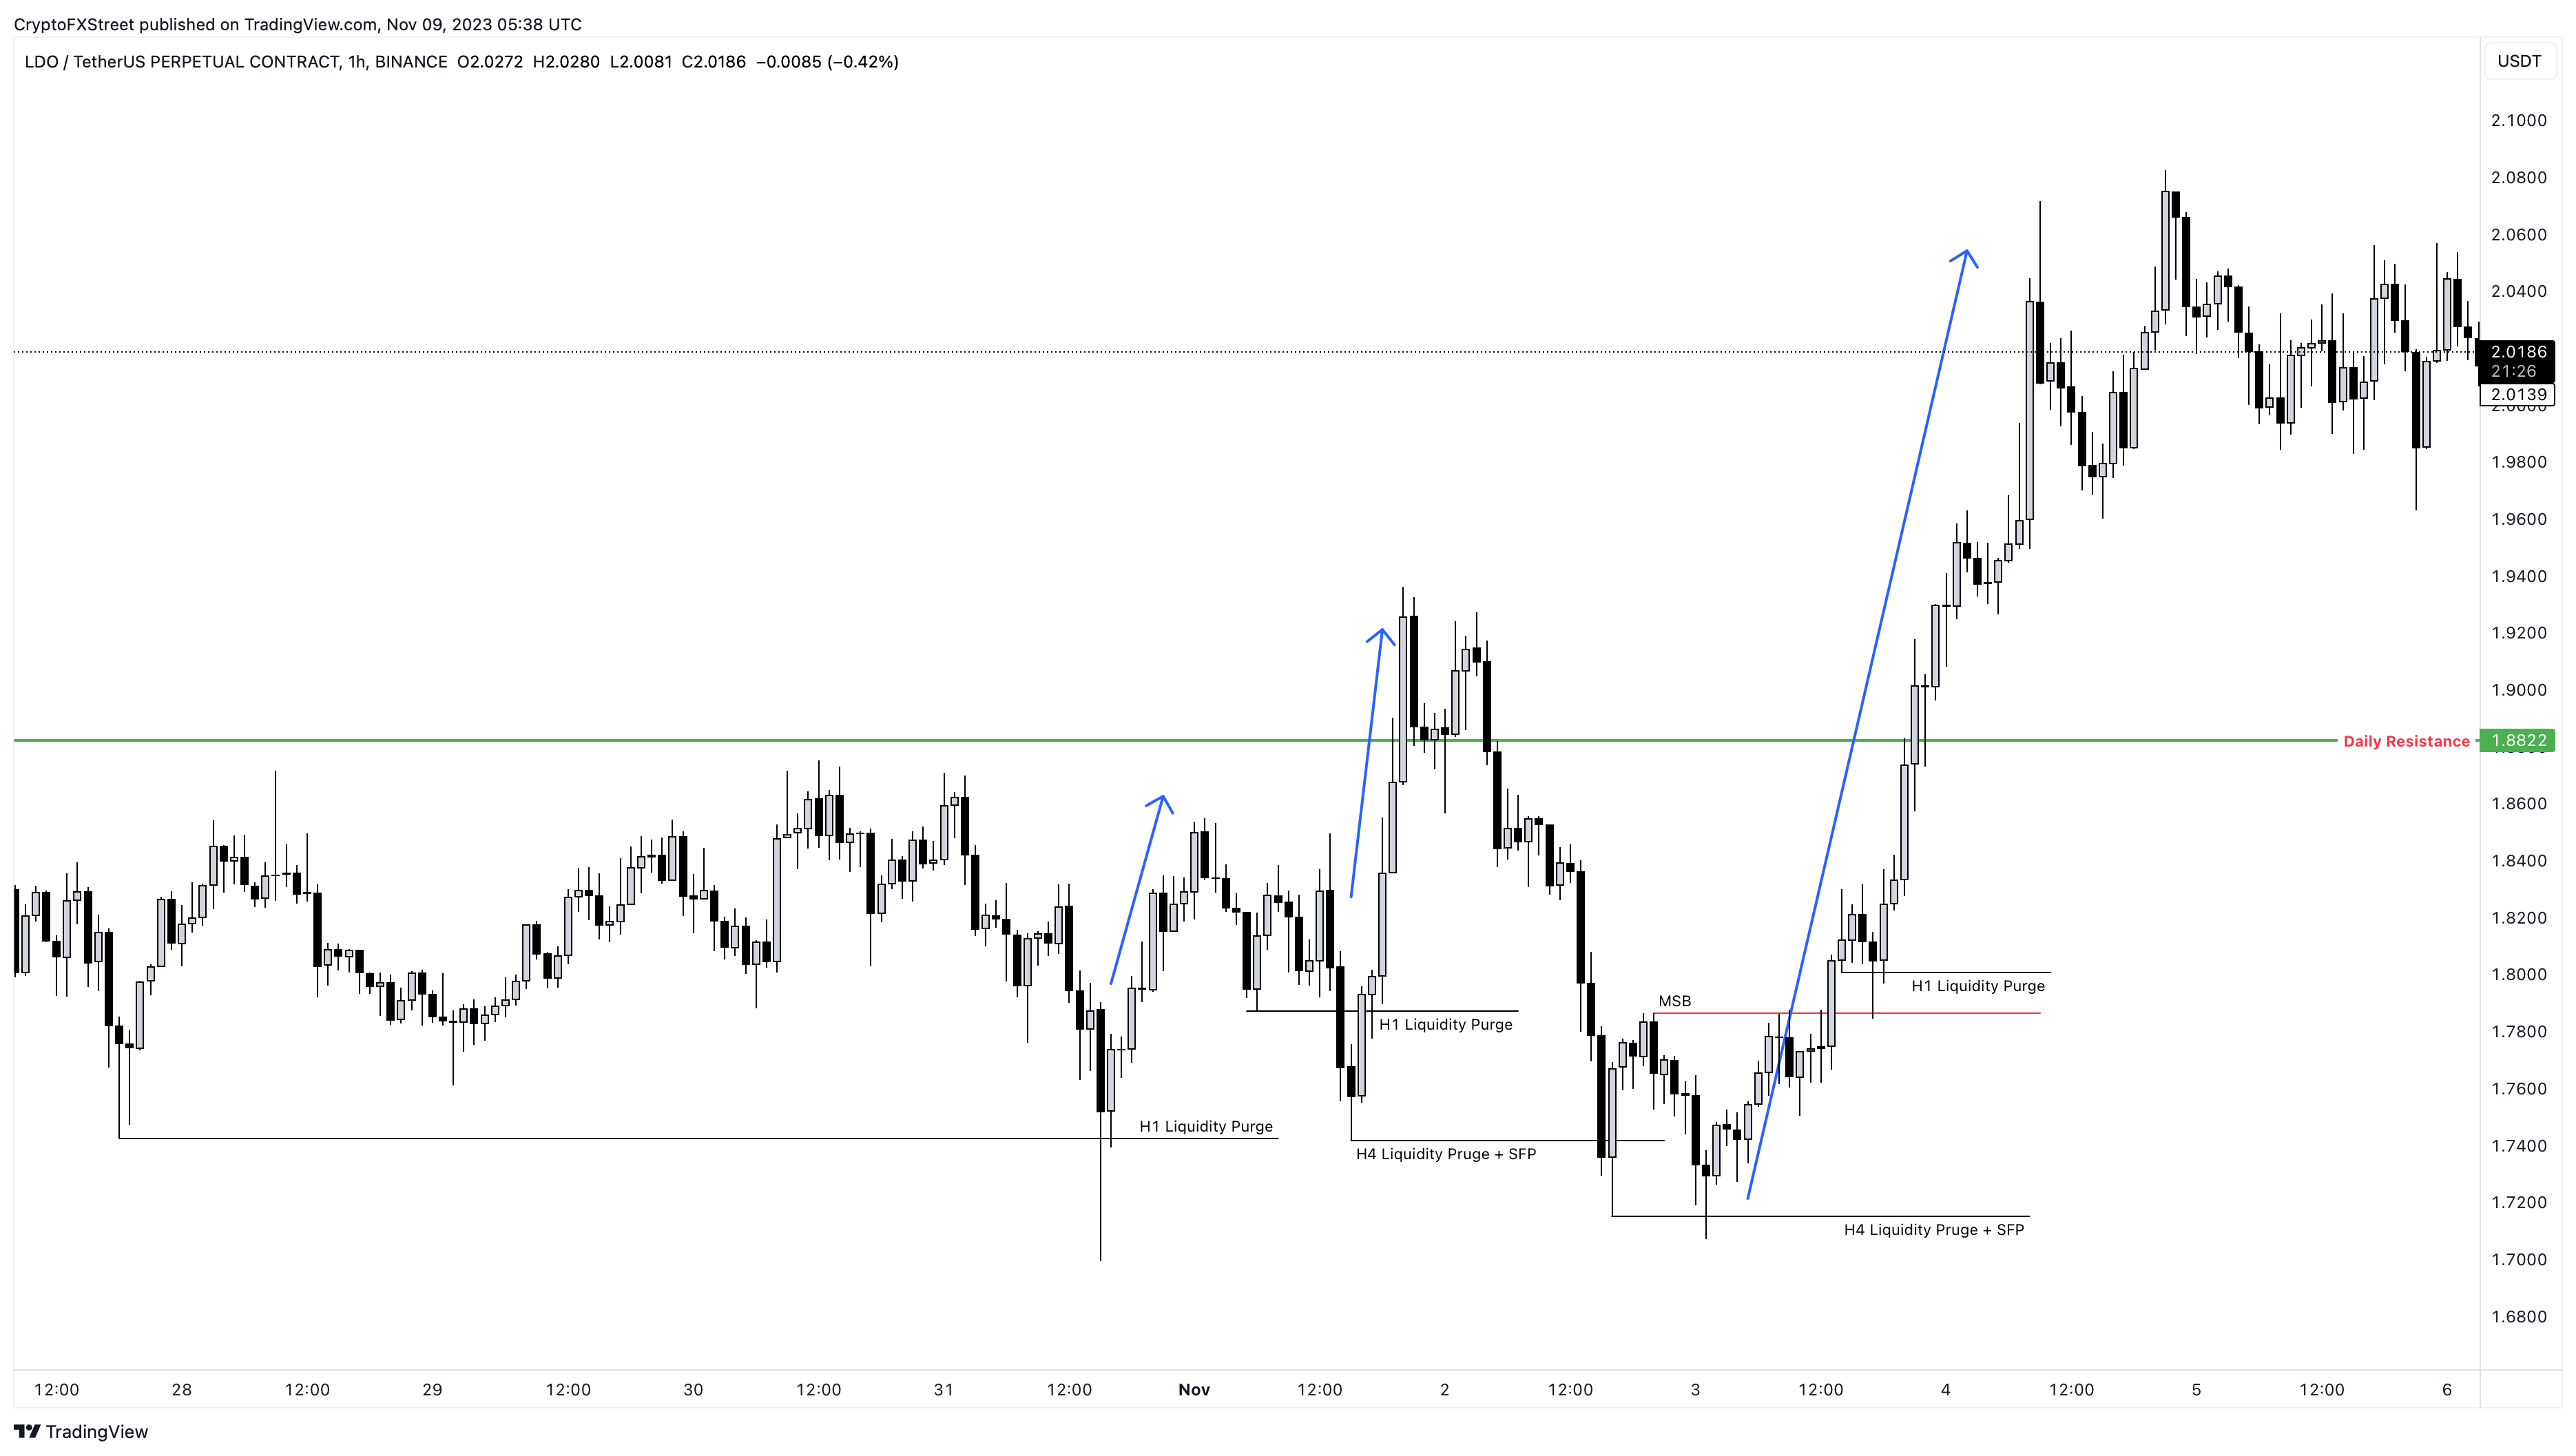
LDO/USDT 1-hour chart
While there are many methods to scout trade entries, liquidity runs below key levels – coupled with a shift in market structure, also known as a trend reversal with production of higher highs or lower lows – is a fairly easy strategy for trading bull markets. Combining this strategy with momentum indicators as noted above makes this a high probability strategy.
Read more: MATIC price could extend gains, makes comeback above $0.80 alongside altcoin rallies
Author

Akash Girimath
FXStreet
Akash Girimath is a Mechanical Engineer interested in the chaos of the financial markets. Trying to make sense of this convoluted yet fascinating space, he switched his engineering job to become a crypto reporter and analyst.


