Ripple price steady above key support as on-chain metric suggests bullish outlook
- Ripple price stabilizes above its daily support level of $0.544, eying a rally ahead.
- On-chain data paints a bullish picture as XRP’s open interest is rising and is highest in one month.
- A daily candlestick close below $0.544 would invalidate the bullish thesis.
Ripple (XRP) stabilizes and trades above a key support level on Monday after a nearly 3% rise last week. However, the on-chain data hints at a rally ahead as XRP’s open interest is rising and reaching the highest level in one month, indicating new buying is occurring.
Ripple on-chain metric shows potential for a rally
Ripple price trades above an ascending trendline (drawn from connecting multiple low levels from early July ) and has been consolidating above its daily support level of $0.544 over the past week. This daily level is a crucial support zone because it closely matches with the 200-day Exponential Moving Average (EMA) at $0.552. As of Monday, XRP trades at around $0.588.
If the 200-day EMA and the daily support around $0.544 manage to hold, XRP could continue its upward trend and retest its daily resistance level at $0.626.
The Moving Average Convergence Divergence (MACD) indicator further supports XRP’s rise, signaling a bullish crossover on the daily chart. The MACD line (blue line) moved above the signal line (yellow line), giving a buy signal. It shows rising green histogram bars above the neutral line zero, also suggesting that Ripple’s price could experience upward momentum.
Additionally, the Relative Strength Index (RSI) indicator trades at 56, above its neutral level of 50. A cross to levels over 60 would indicate that bullish momentum is gaining traction.
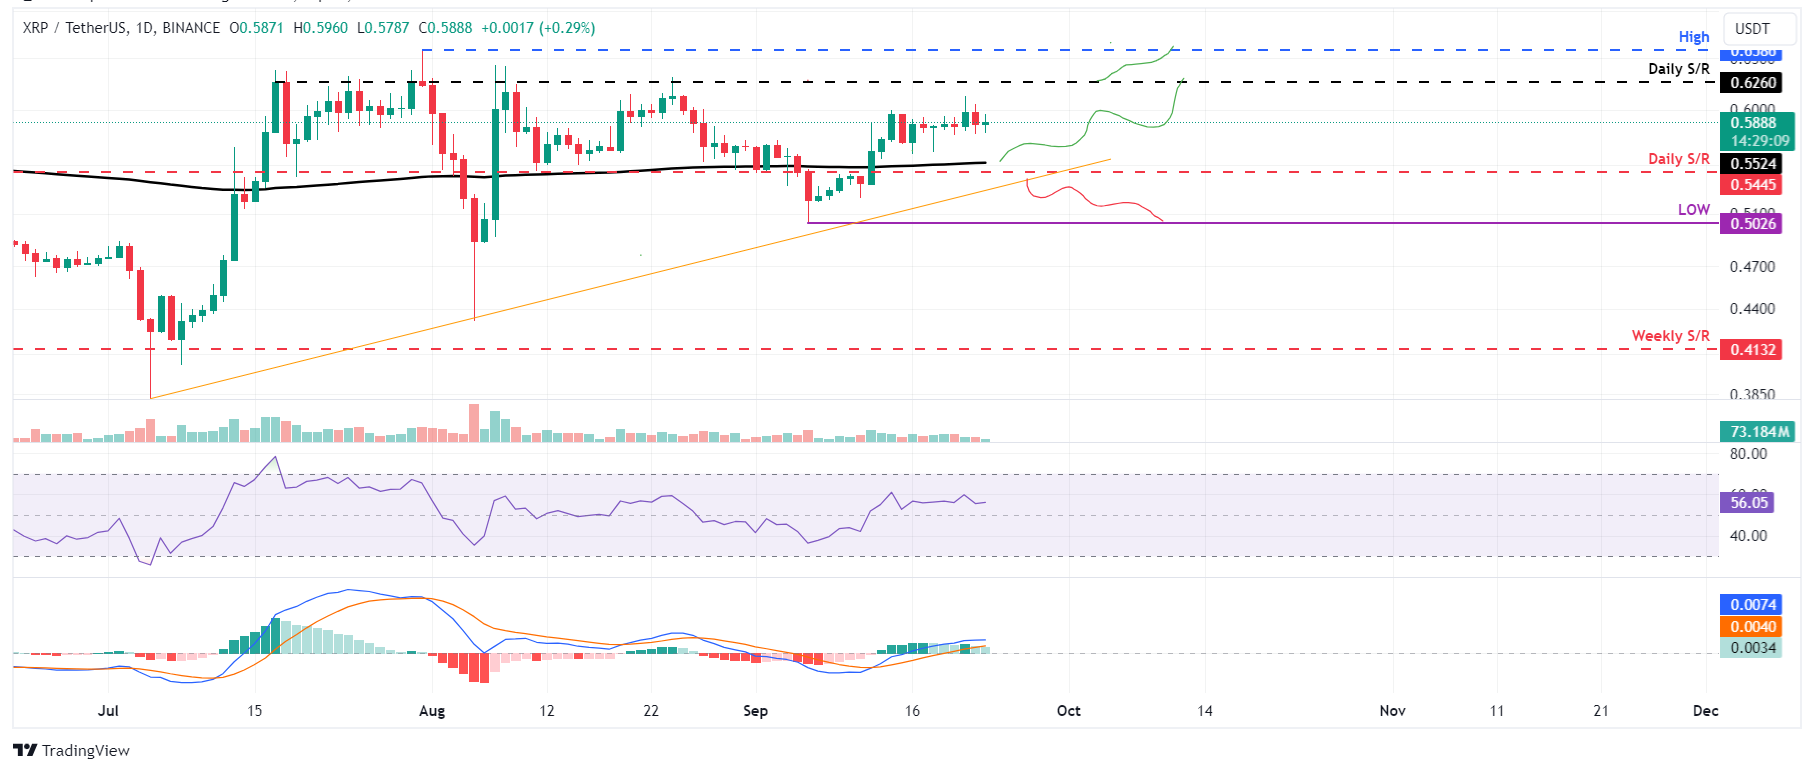
XRP/USDT daily chart
Ripple’s on-chain data further supports the bullish thesis. Coinglass’s data shows that the futures’ Open Interest (OI) of XRP at exchanges is also increasing. The OI indicates the total number of outstanding derivative contracts that have not been settled (offset by delivery) and whether money flows into the contract are increasing or decreasing.
Increasing OI represents new or additional money entering the market and new buying, which suggests a bullish trend. On the contrary, when OI decreases, it is usually a sign that the market is liquidating, more investors are leaving, and prices may decrease.
The graph below shows that Ripple’s OI increased from $639.08 million on Thursday to $754.65 million on Sunday, the highest level in over a month. This rise indicates that new or additional money is entering the market and new buying is occurring.
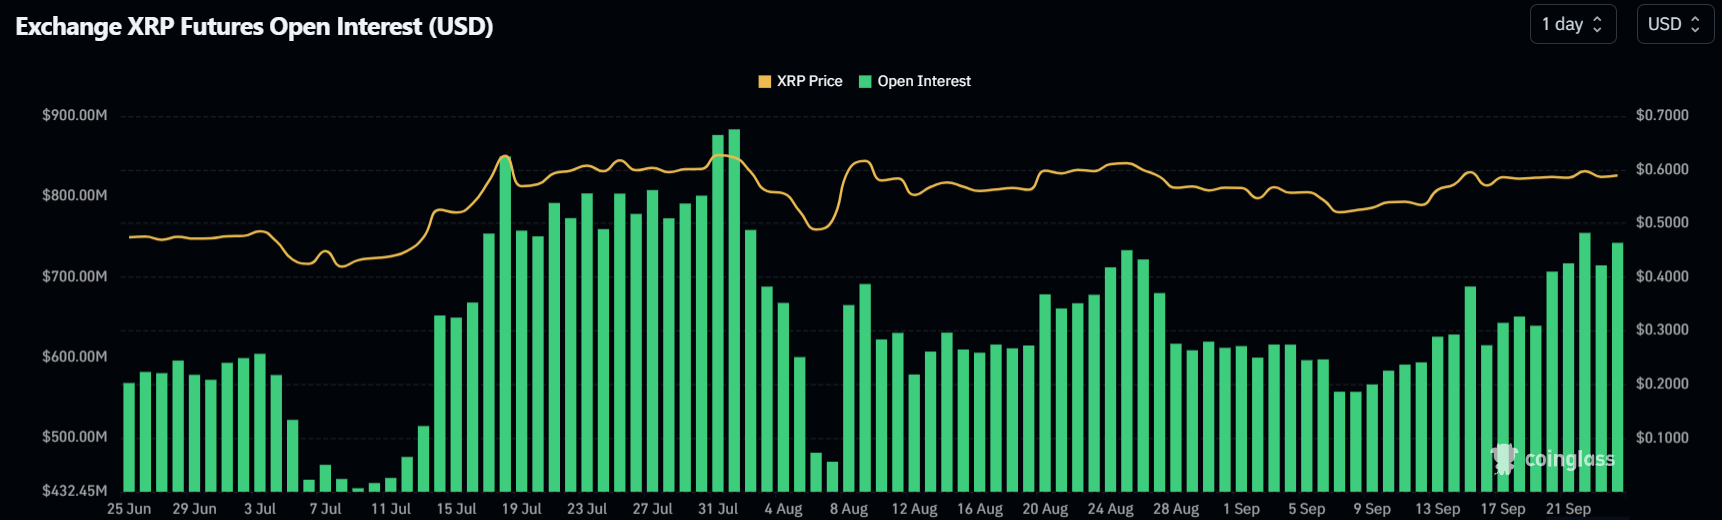
XRP Open Interest Chart
However, the bullish outlook would be invalidated if Ripple’s daily candlestick closes below the $0.544 daily support level and breaks below the ascending trendline. In such a case, XRP would decline 7.5% to retest its September 6 low of $0.502.
Ripple FAQs
Ripple is a payments company that specializes in cross-border remittance. The company does this by leveraging blockchain technology. RippleNet is a network used for payments transfer created by Ripple Labs Inc. and is open to financial institutions worldwide. The company also leverages the XRP token.
XRP is the native token of the decentralized blockchain XRPLedger. The token is used by Ripple Labs to facilitate transactions on the XRPLedger, helping financial institutions transfer value in a borderless manner. XRP therefore facilitates trustless and instant payments on the XRPLedger chain, helping financial firms save on the cost of transacting worldwide.
XRPLedger is based on a distributed ledger technology and the blockchain using XRP to power transactions. The ledger is different from other blockchains as it has a built-in inflammatory protocol that helps fight spam and distributed denial-of-service (DDOS) attacks. The XRPL is maintained by a peer-to-peer network known as the global XRP Ledger community.
XRP uses the interledger standard. This is a blockchain protocol that aids payments across different networks. For instance, XRP’s blockchain can connect the ledgers of two or more banks. This effectively removes intermediaries and the need for centralization in the system. XRP acts as the native token of the XRPLedger blockchain engineered by Jed McCaleb, Arthur Britto and David Schwartz.
Author

Manish Chhetri
FXStreet
Manish Chhetri is a crypto specialist with over four years of experience in the cryptocurrency industry.


