Memecoins DOGE and PEPE approaches key levels: Eyes for a recovery
- Dogecoin and Pepe prices retest their crucial support level on Thursday after declining more than 10% this week.
- Sideline investors looking to accumulate DOGE and PEPE can do around their support levels.
- Traders should still be cautious as both memecoins show signs of weakness in momentum indicators.
Dogecoin (DOGE) and Pepe (PEPE) prices retest their crucial support level on Thursday after declining more than 10% this week. Sideline investors seeking to accumulate dog-themed and frog-themed memecoins may consider doing so at their support levels for a potential recovery rally ahead.
Dogecoin price shows potential for a recovery
Dogecoin price reached a new yearly high of $0.48 on December 8 and declined more than 23% in the next 10 days. On Tuesday, DOGE retested the 50-day Exponential Moving Average (EMA) at $0.35. This level roughly coincides with the 61.8% Fibonacci retracement level drawn from the November 3 low of $0.14 to its December 8 high of $0.48 at $0.35, making it a key reversal zone. At the time of writing on Thursday, it recovers slightly, trading around 0.36.
Sideline investors looking to accumulate the dog-themed memecoin can do around the $0.35 level.
If the $0.35 support level holds and DOGE recovers, it could extend the recovery by 13.5% to retest its Tuesday high of $0.41.
However, the daily chart's Relative Strength Index (RSI) has slipped below its neutral level of 50, indicating strong bearish momentum. If bulls are indeed making a comeback, the RSI must maintain its position above its neutral level. Such a development would add a tailwind to the recovery rally.
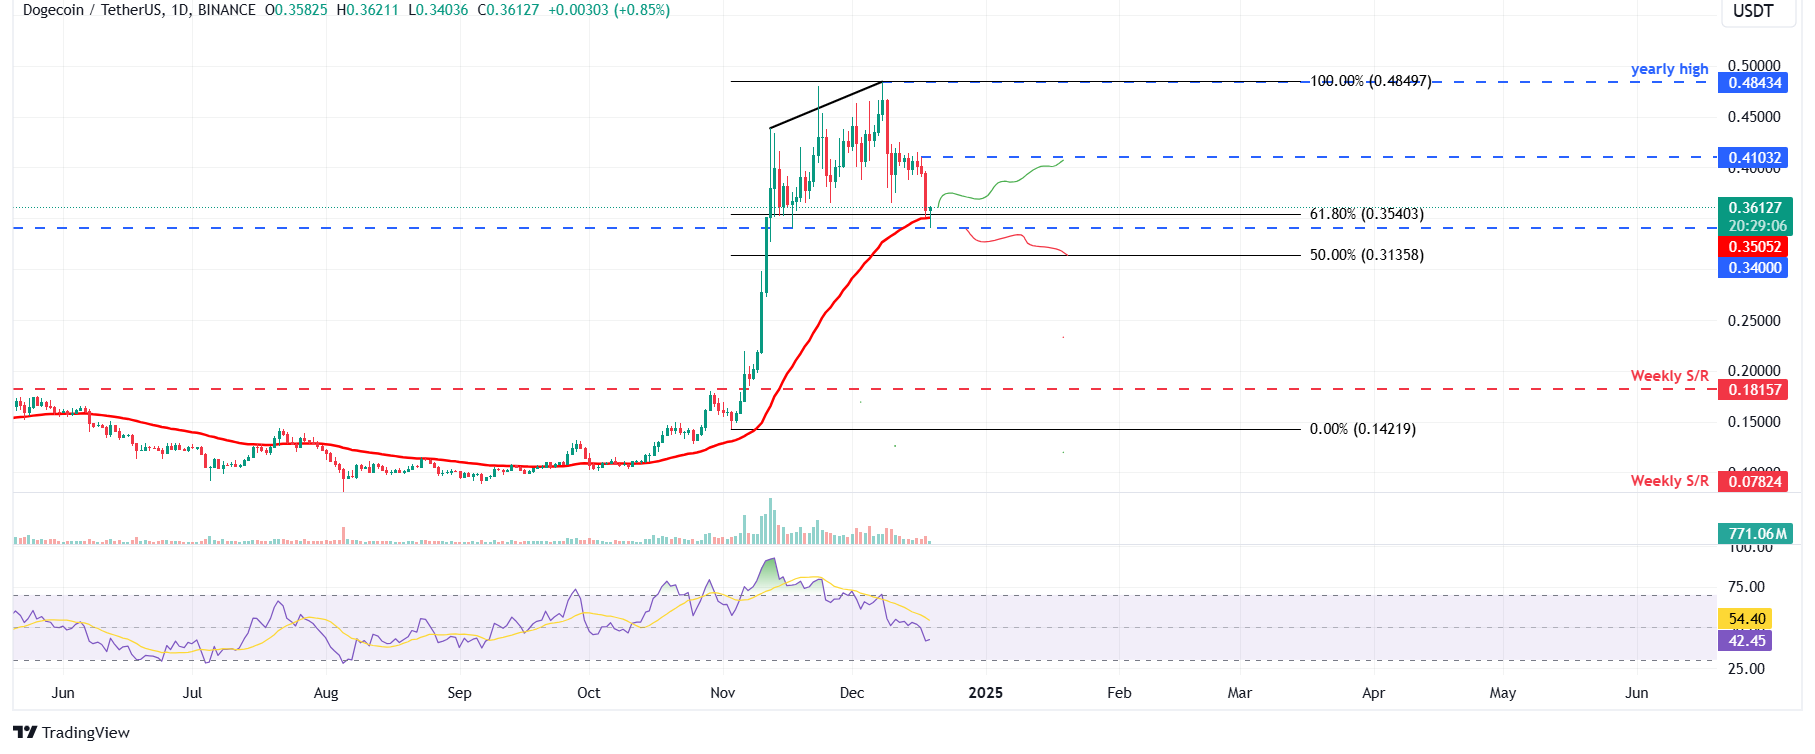
DOGE/USDT daily chart
However, if DOGE fails to find support around $0.35 and closes below $0.34, it could extend the decline by 7% to retest its next support level at $0.31.
PEPE price looks promising
Pepe price reached a new all-time high (ATH) of $0.000028 on December 9 and faced a correction of 26.6% in the next 9 days. As of Thurday, it retests the 50% price retracement level drawn from the November 4 low of $0.000007 to its ATH of $0.000028 at $0.000018. This level roughly coincides with the daily support level of $0.000017, making this a key reversal zone.
Like DOGE, sideline investors can accumulate the frog-themed memecoin around the $0.000018 level.
If PEPE bounces off the $0.000018 level, it could extend the recovery by 28% to retest its Monday high of $0.000024.
However, the daily chart's RSI has slipped below its neutral level of 50, indicating strong bearish momentum. If bulls are indeed making a comeback, the RSI must maintain its position above its neutral level. Such a development would add a tailwind to the recovery rally.
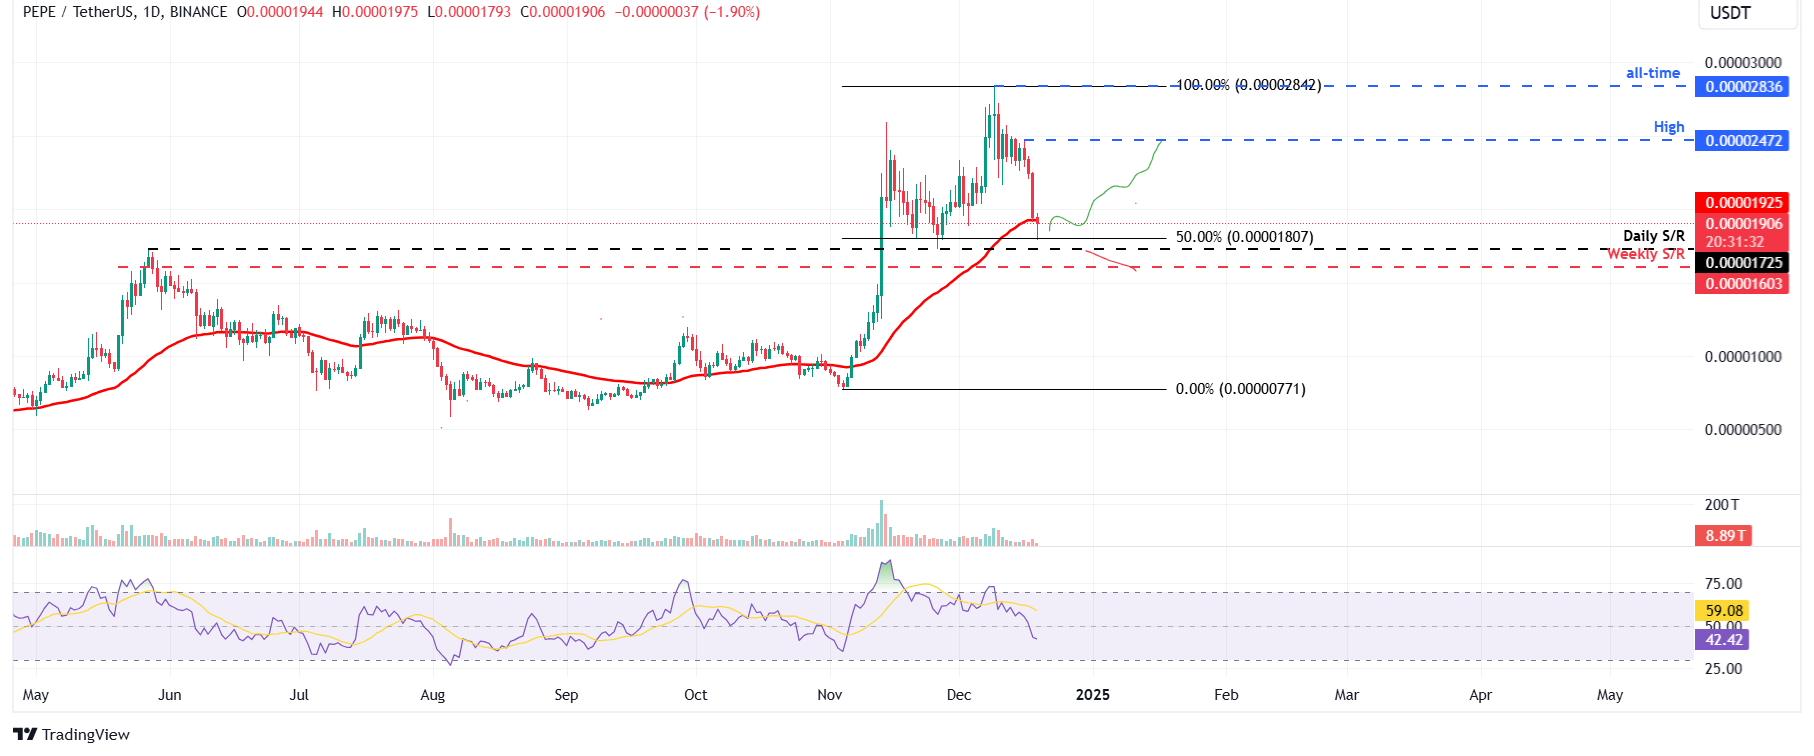
PEPE/USDT daily chart
Conversely, if PEPE fails to find support around $0.000018 and closes below $0.000017, it could extend the decline by 6.8% to retest its weekly support level at $0.000016.
Author

Manish Chhetri
FXStreet
Manish Chhetri is a crypto specialist with over four years of experience in the cryptocurrency industry.


