Altcoins Cardano and Avalanche poised for double-digit correction
- Cardano’s price continues to trade down on Wednesday, correcting nearly 7% so far this week.
- Avalanche’s price also edges down on Wednesday, continuing its pullback by more than 8% this week.
- ADA and AVAX’s long-to-short ratios are below one, suggesting that more traders are betting on the asset prices to fall.
Cardano (ADA) and Avalanche (AVAX) prices continue to trade down on Wednesday after correcting more than 7% and 8%, respectively, so far this week. The technical outlook and on-chain metrics for both altcoins suggest the continuation of the pullback.
Cardano bulls show signs of exhaustion
Cardano’s price action on the weekly chart was rejected at the 50% price retracement level (drawn from the November 2021 high of $2.37 to the December 2022 low of $0.23) at $1.30 in the first week of December after rallying more than 250% since early November. Since then, ADA has declined over 20% to trade, at the time of writing on Wednesday, at around $1.02.
If ADA continues its correction, it could extend the decline by 25% to retest its next weekly support at $0.74.
The Relative Strength Index (RSI) momentum indicator in the weekly chart also supports a correction in Cardano price. The RSI shows overbought conditions and points downward. If it slips below the overbought level of 70, it would indicate weakness in bullish momentum, and chances of a continuation of the pullback in ADA will increase.
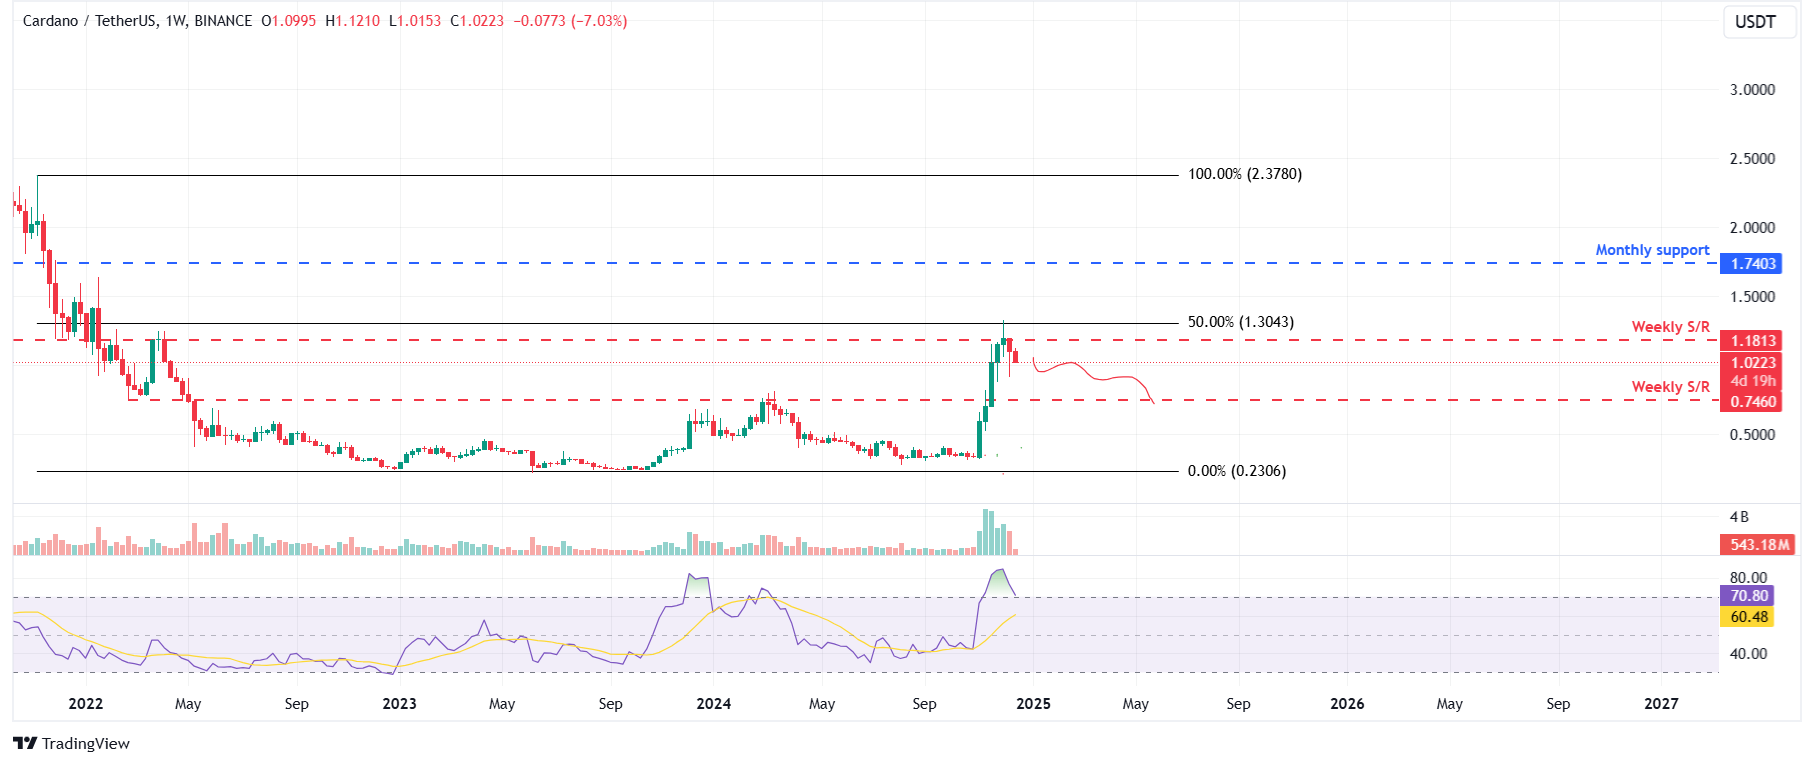
ADA/USDT weekly chart
Additionally, Coinglass data shows that Cardano’s long-to-short ratio stands at 0.82, the lowest level in a month, indicating bearish sentiment in the market. The ratio below one suggests that more traders are betting for the asset price to fall, bolstering ADA’s bearish outlook.
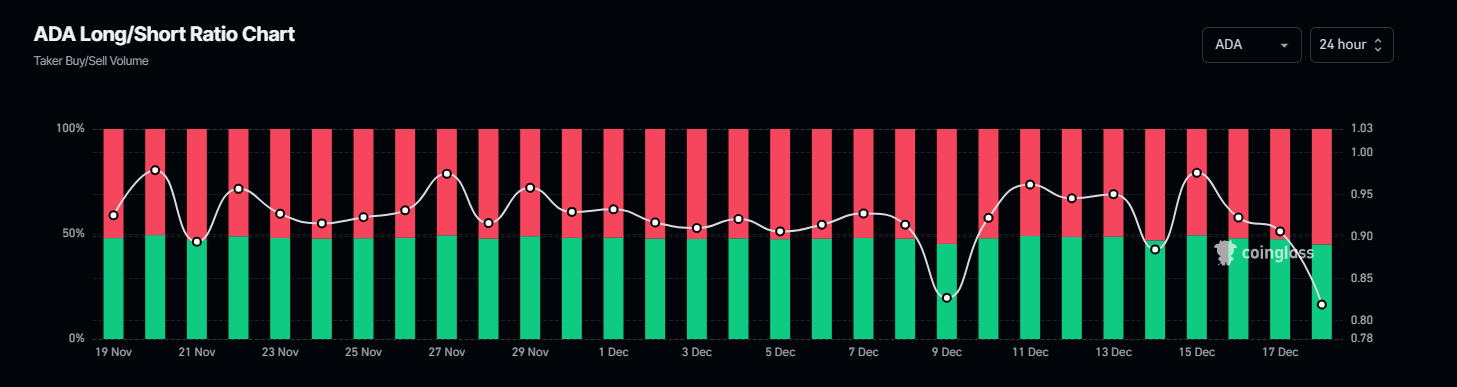
ADA long-to-short ratio chart. Source: Coinglass.
Avalanche price is poised for a pullback
Avalanche weekly chart shows that it surged more than 120% since early November and faced resistance around the $55.76 level during the first week of December. Since then, AVAX has declined over 15% to trade at $46.40 at the time of writing on Wednesday.
If AVAX continues its pullback, it could extend the decline by 12% to retest its next weekly support at $40.55.
The RSI on the weekly chart supports Avalanche price pullback. It reads 62 and points downwards after rejecting its overbought level of 70 on December 2, indicating weakness in bullish momentum. If the RSI closes below the neutral level of 50, AVAX prices will fall sharply.

AVAX/USDT weekly chart
Like Cardano, Avalanche’s long-to-short ratio stands at 0.80, the lowest level in a month, indicating bearish sentiment in the market.
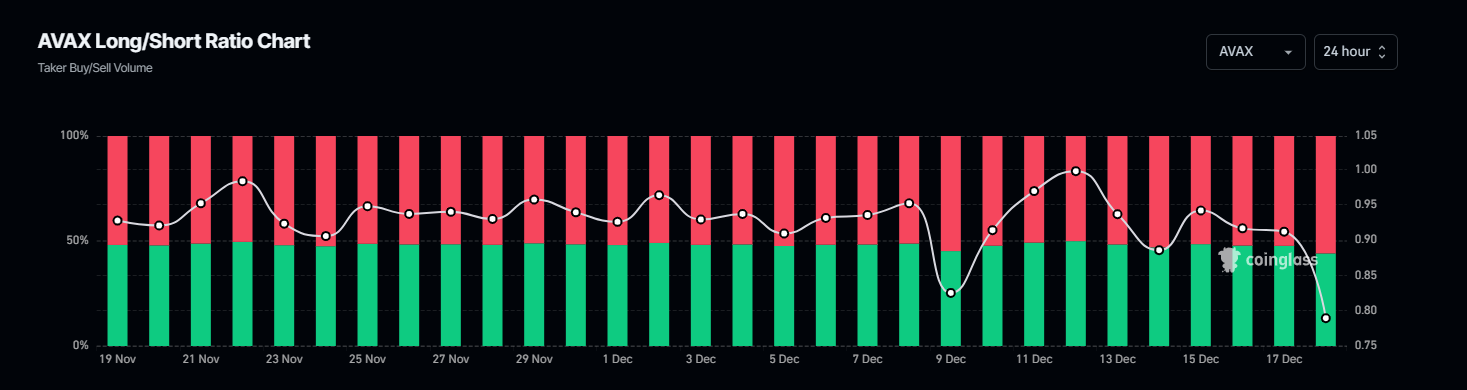
AVAX long-to-short ratio chart. Source: Coinglass.
Author

Manish Chhetri
FXStreet
Manish Chhetri is a crypto specialist with over four years of experience in the cryptocurrency industry.


