MATIC price triggers 62% upswing as Dharma uses Polygon to eliminate gas fees
- MATIC price breached the neckline of an inverse head-and-shoulders pattern, suggesting a 62% upswing.
- Dharma leverages Polygon’s solutions to allow its users to trade cryptocurrencies without fees.
- A decisive close below the September 3 swing low at $1.40 will invalidate the bullish thesis.

MATIC price is looking to advance higher and recover to levels last seen on May 18. On this note, Polygon has already breached a crucial barrier and is looking to kick-start its massive upswing.
Polygon lends a hand to Dharma
In a recent announcement on September 3, Dharma, an Etheruem wallet that connects to traditional bank accounts, stated that it had enabled Polygon network support. This development will allow Dharma and its users to leverage the Layer 2 scaling solution’s features like low gas fees, high throughput, and low latency transactions.
Regarding this launch, Dharma stated,
Today, users around the world can experience the magic of DeFi, through a beautiful and intuitive user experience, with zero network fees.
The 2017, 2018 bull run, the DeFi summer in 2020 and the 2021 bull run made it clear that transacting on the Ethereum blockchain during phases of hype was next to impossible due to high gas fees. Users willing to spend thousands of dollars on gas fees were allowed to jump on exciting new launches and profit from that exclusivity, while retail was mostly left out.
Dharma adds in their blog how they tried to circumvent this by subsidizing user transactions. However, this alternative method was not enough during busy days, which led them to Polygon. This integration will give users the ability to cash out to their bank accounts directly with Polygon wallet.
MATIC price kick-starts a mini bull run
MATIC price is forming an inverse head-and-shoulders pattern, which broke out on September 3. This technical pattern contains three swing lows, with the middle one the deepest and known as the head. The swing lows on either side of the head form the shoulders.
The peaks of these swing lows can be connected using a horizontal trend line referred to as the neckline at $1.66.
This setup forecasts a 62% upswing, obtained by measuring the distance between the head’s lowest point and the neckline and adding the breakout point at $1.66.
On September 3, MATIC price breached the neckline at $1.66 as it produced a 12-hour candlestick close above it, confirming a breakout. Therefore, investors can expect a continuation of this uptrend to slice through the $1.94 and $2.32 resistance barriers before getting a chance to tag the intended target at $2.70, coinciding with the all-time high.
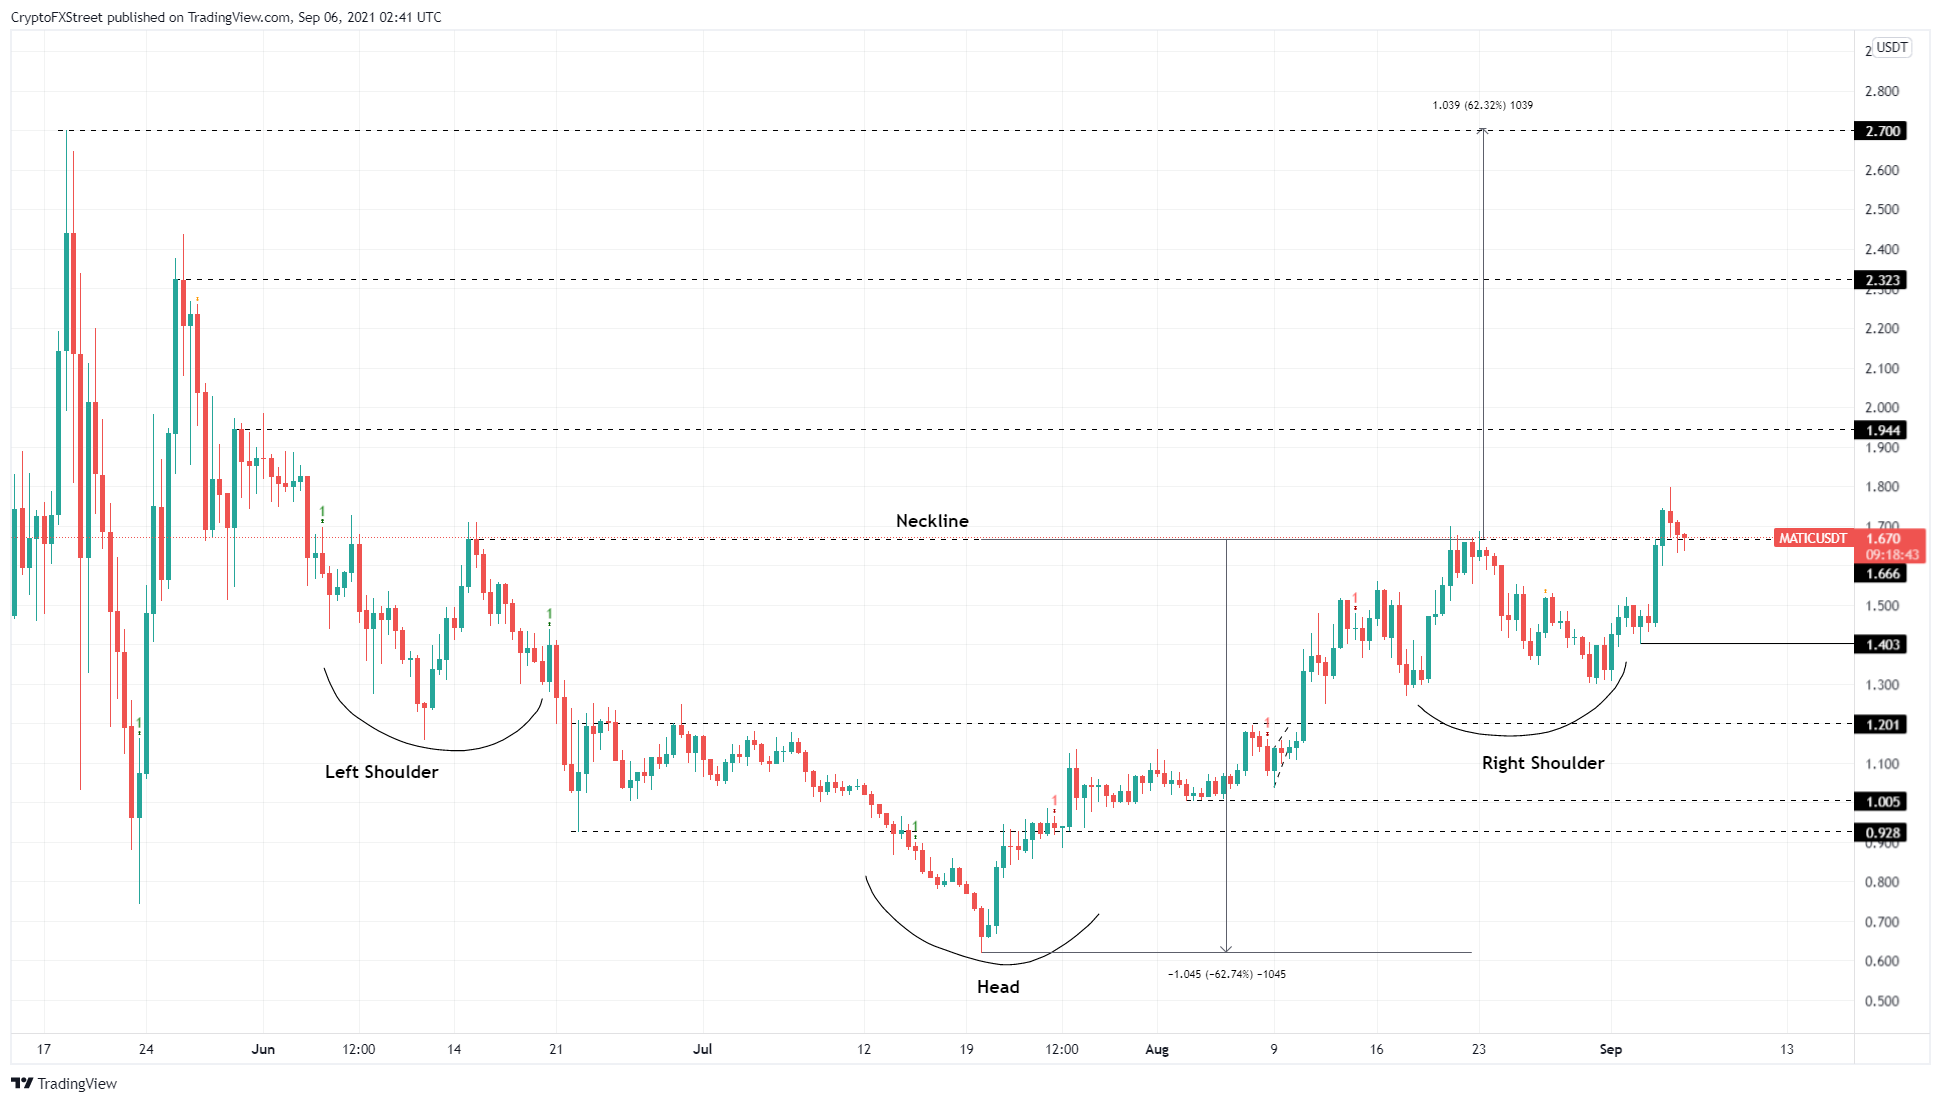
MATIC/USDT 12-hour chart
While MATIC price has breached the neckline at $1.66, it is uncertain that this uptrend will continue. In a bearish case, the bears might break below the horizontal resistance at $1.66, indicating weak buying pressure.
If the bulls fail to reclaim the said barrier, it will lead to a further downswing, but a breakdown of the September 3 swing low at $1.40 will invalidate the bullish thesis.
Author

Akash Girimath
FXStreet
Akash Girimath is a Mechanical Engineer interested in the chaos of the financial markets. Trying to make sense of this convoluted yet fascinating space, he switched his engineering job to become a crypto reporter and analyst.



