MATIC Price Prediction: Polygon could correct as this technical indicator hints of incoming reversal signal
- MATIC price broke out from an ascending triangle’s upper trendline as it surged 55%.
- Transactional data shows stable support due to a massive concentration of buyers below the current price.
- If the $0.40 level is breached, a 30% drop to the next substantial demand barrier around the $0.24 level is possible.

Matic price rally shows massive returns for holders, but a technical indicator warns that a reversal could be around the corner.
MATIC price rally depends on bulls’ persistence
MATIC price has seen a 377% increase over the last month. However, this growth wasn’t linear but a result of higher highs and higher lows. Drawing trendlines that connect the swing highs and swing lows creates an ascending parallel channel.
Polygon’s 55% run-up seen on March 11 has pushed it above the technical formation’s upper trendline. However, Tom DeMark (TD) Sequential indicator has flashed a “green-eight” above the current price action. If the next candlestick close is higher than the close 4 bars prior, a sell signal will flash in the form of a green nine candlestick on the daily chart.
In such a case, this setup forecasts a one-to-four candlestick correction to the immediate support at $0.40. A sudden spike in selling pressure leading to a decisive close below this demand barrier would trigger a sell-off that pushes MATIC price into the ascending parallel channel formation.
Here, MATIC price could find support around the 61.8% Fibonacci retracement level at $0.24.
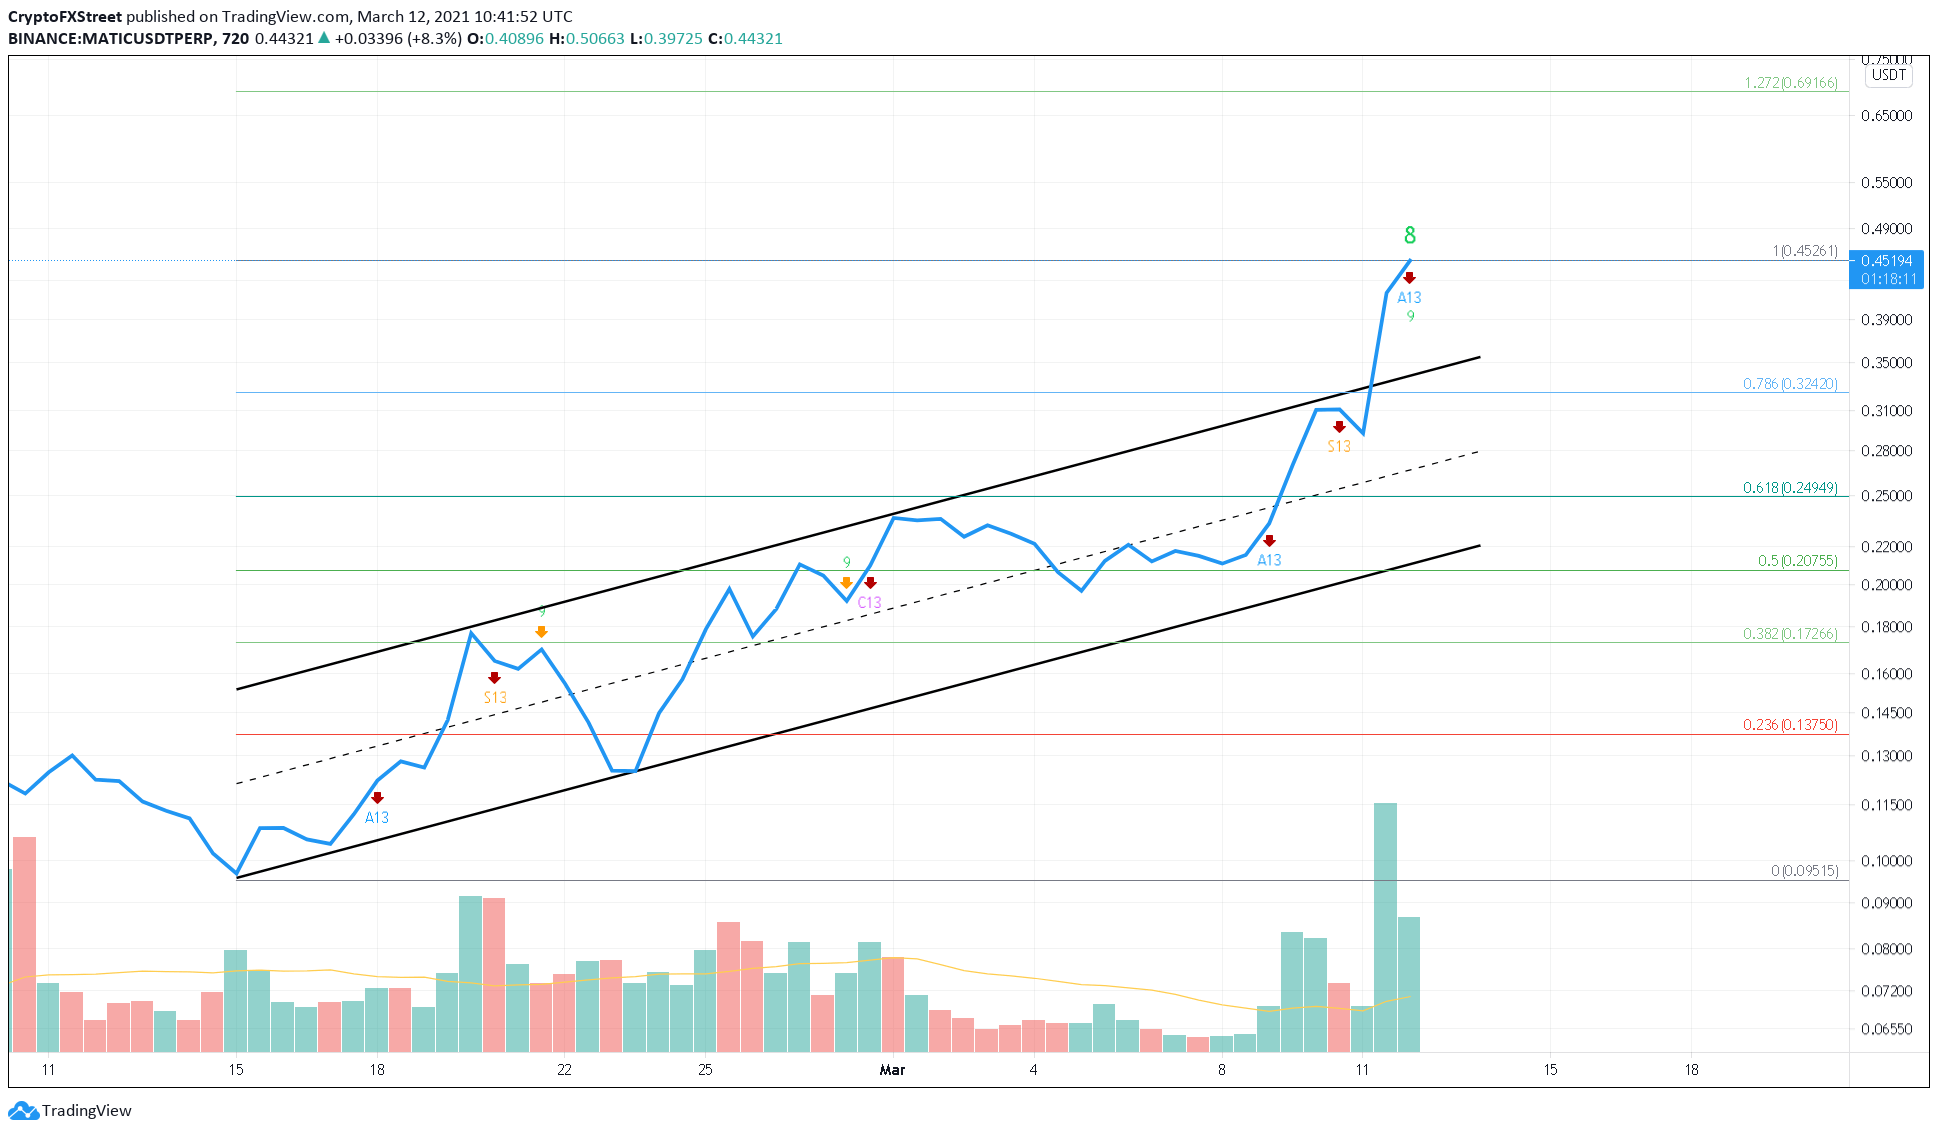
MATIC/USDT 1-day chart
Regardless of the bearish indications, IntoTheBlock’s Global In/Out of the Money (GIOM) model shows that $0.40 is a stable support level. Here roughly 2,500 addresses hold nearly 312 MATIC tokens.
MATIC GIOM Chart
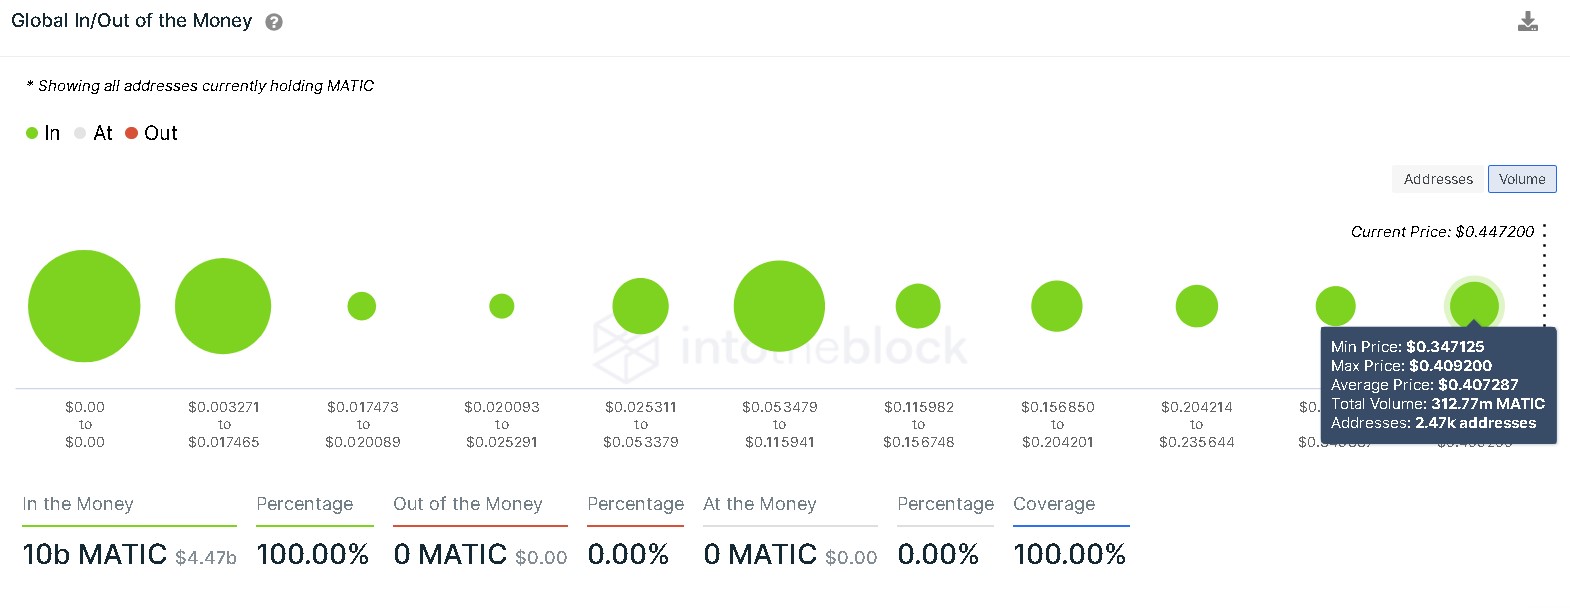
Therefore, it is likely that the descent could be cut short by the investors present in the range. Additionally, this small pullback to $0.40 will provide buyers a respite and allow them to come back stronger. In this scenario, Polygon could quickly surge another 50% to hit $0.69, which coincides with the 127.2% Fibonacci retracement level.
Author

Akash Girimath
FXStreet
Akash Girimath is a Mechanical Engineer interested in the chaos of the financial markets. Trying to make sense of this convoluted yet fascinating space, he switched his engineering job to become a crypto reporter and analyst.



