MATIC price might be headed towards correction after skyrocketing by 30%
- MATIC price noted a steady incline during October, bringing the coin close to $1 and shooting past it on Friday.
- MATIC could see some red candles over the next few days to allow the market to cool down.
- Investors holding MATIC might begin booking profits as the altcoin is in the Danger Zone currently.

MATIC price has broken the record for monthly gains of a cryptocurrency in less than 24 hours, clearing major resistances. However, with a rise so sharp, buying pressure is through the roof. Thus, the market might need some time to return to normalcy, after which this is where MATIC and its investors could be standing.
MATIC price in the last 24 hours
MATIC price has left the market surprised, marking a 30% increase in just 24 hours. Adding this increase to the green candle from the day before makes MATIC’s two days rise over 41%. Over the month, the altcoin had managed to mark decent growth as the price inclined by about 34.83%. However, following it, indications of a possible fall in price were visible.
Nonetheless, indicators kept highlighting potential bullishness, which set the price target above $1, and MATIC achieved the same as the altcoin can be seen trading at $1.23. In doing so, the cryptocurrency cleared two major resistances, the 50% Fib level and the 61.8% Fib line of the Fibonacci Retracement of $1.69 to $0.34 decline.

MATICUSD 1-day chart
However, going forward, it seems like MATIC could be experiencing corrections. Firstly following the incline, investors jumped on the bullish train to accumulate or book profits, resulting in the buying pressure exceeding the threshold.
As visible on the Relative Strength Index (RSI), MATIC is overbought and will need some time to cool down and retrace to the bullish zone below 70.0.

MATIC RSI
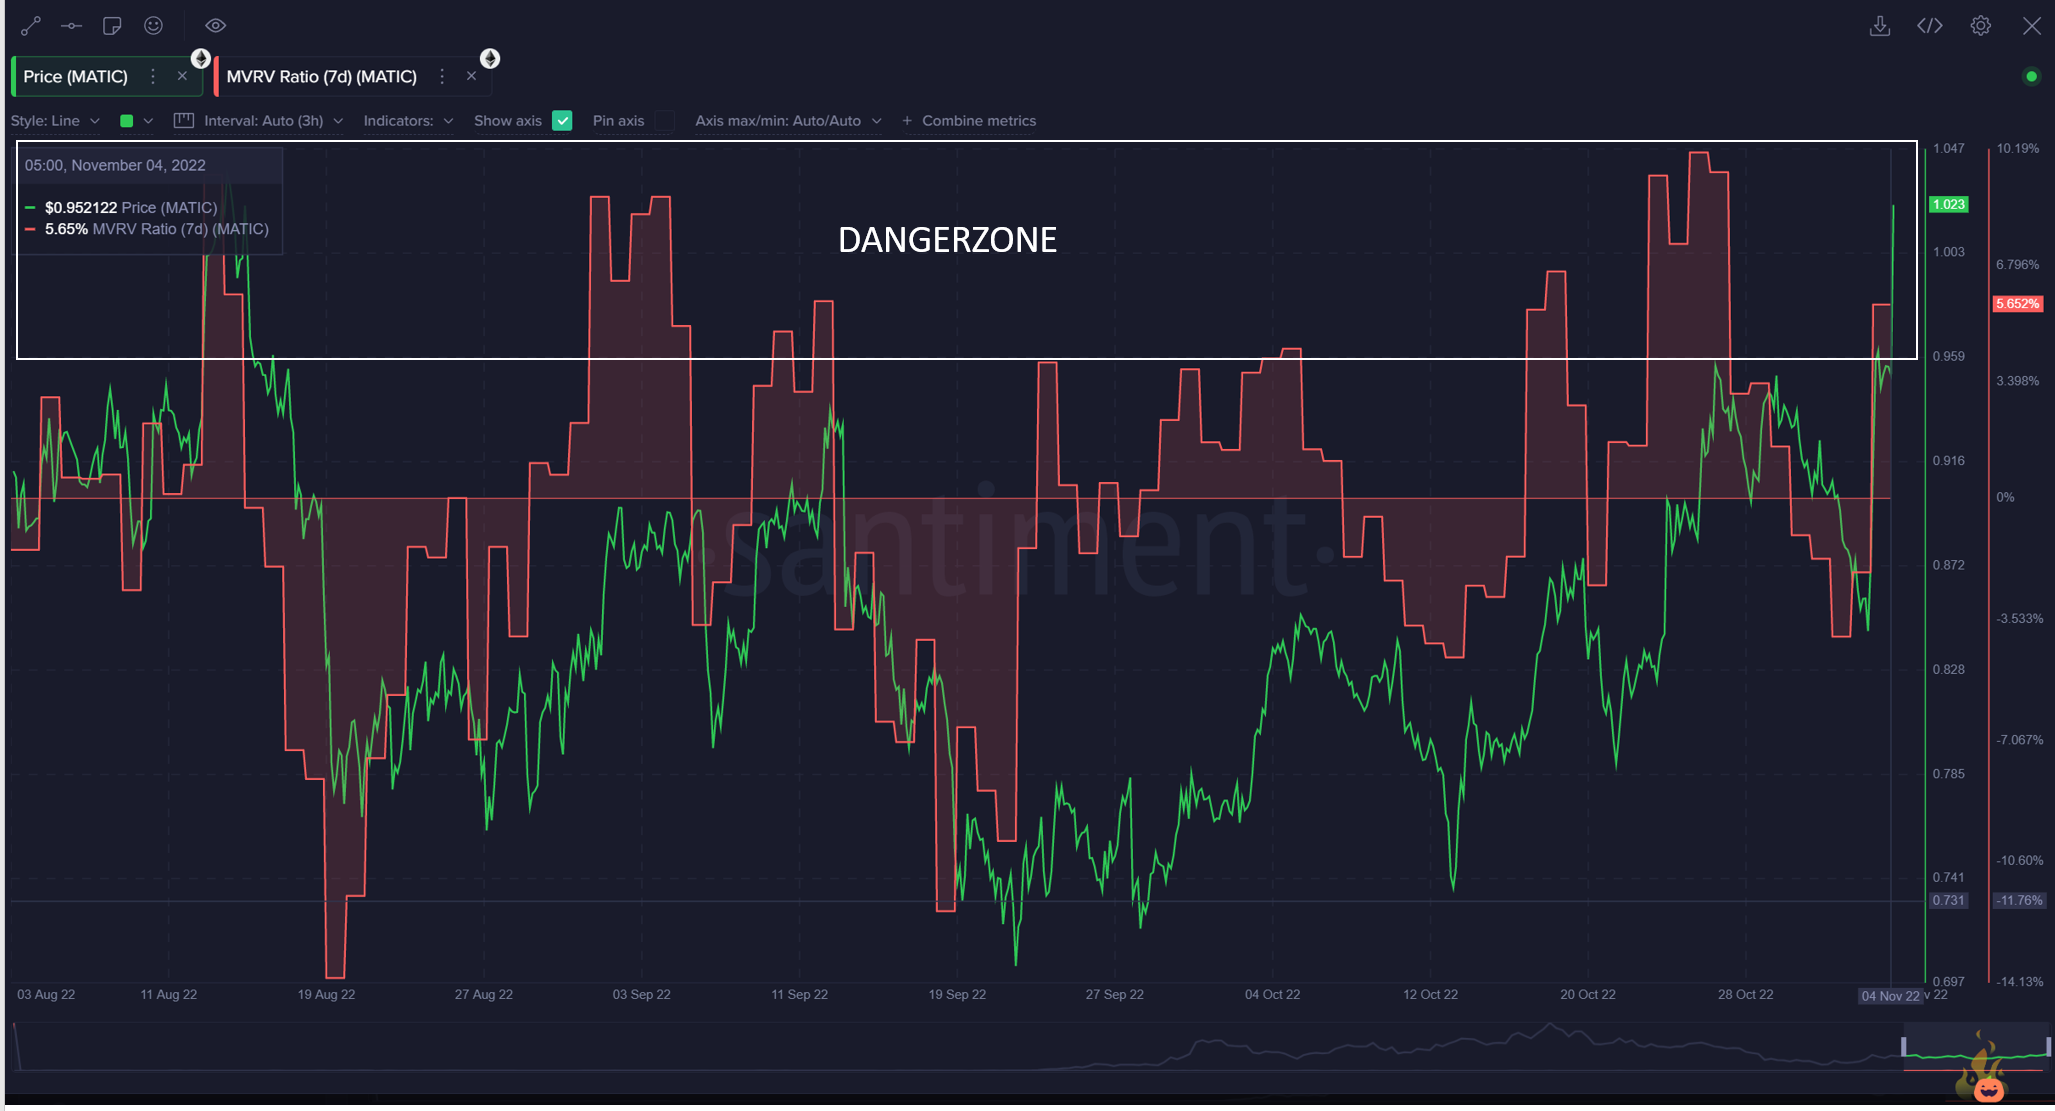
Secondly, the market value to realized value (MVRV) ratio points in the same direction. The indicator is used to assess the relative value (overvalued or undervalued) of the asset by comparing the market value of the asset to its realized value (original cost of the supply). The 7-day chart highlights the micro conditions which show that MATIC is in the danger zone.
A reach into this area has resulted in price declines historically. This is because the danger zone presents profit-booking opportunities for investors, which leads to a sell-off. Thus a price drop is set in motion.
Should that happen, investors can expect MATIC to test $1.1 as its immediate support or fall back down to $1 under extreme conditions. If not, then a consistent incline will result in MATIC reaching $1.30 over the next couple of days (ref. MATICUSD 1-day chart)
What triggered the rise?
There is no one answer to why MATIC suddenly skyrocketed, as one event cannot be singled out amid the barrage of developments experienced by Polygon.
As reported by FXStreet, some bullishness came from the launch of NFTs on Instagram, allowing users to create and sell their artwork and more. Furthermore, Polygon was also used as the blockchain of choice by Singapore for conducting its first-ever institutional DeFi trade.
Under the Project Guardian, Polygon was chosen for its cheaper and faster operations for the pilot, which involved DBS Bank, JP Morgan and SBI Digital Assets Holdings.
If Polygon continues to observe more such announcements and developments, MATIC could continue rising further.
Author

Aaryamann Shrivastava
FXStreet
Aaryamann Shrivastava is a Cryptocurrency journalist and market analyst with over 1,000 articles under his name. Graduated with an Honours in Journalism, he has been part of the crypto industry for more than a year now.


