MATIC price holds on thin ice as 38% correction looms
- MATIC price attempts to break above bearish structure.
- A 13% rise in value may occur but is likely to be halted against a collection of intense resistance levels.
- The Relative Strength Index shifts into bear market conditions.

MATIC price moves 6% higher from the Wednesday open, creating a new daily high above the previous high. Buyers find short-term support against the 50% Fibonacci retracement at $1.06. Immediate resistance is the Tenkan-Sen at $1.13 and then the $1.18.
MATIC price finds short term support and finds buyers, strong resistance above $1.13 ahead
MATIC price has found many buyers near the $1.06 level and is currently testing the $1.13 zone as resistance. If bulls can push above $1.13, then a reasonably open space exists for buyers to push MATIC higher towards $1.18 – where price will likely get stalled. Several resistance areas exist within the $1.18 zone.
The $1.18 resistance level contains the 38.2% Fibonacci retracement ($1.19), a high volume node in the volume profile, and Senkou Span B (the most vigorous support/resistance in the Ichimoku Kinko Hyo system). A quick look at the Composite Index shows a crossover of the CI line above its slow and fast-moving averages, indicating an imminent spike higher. However, in creating a bullish spike, the Composite Index will, as a result, develop a negative divergence known as hidden bearish divergence – a warning that the last downside move on MATIC price will continue.
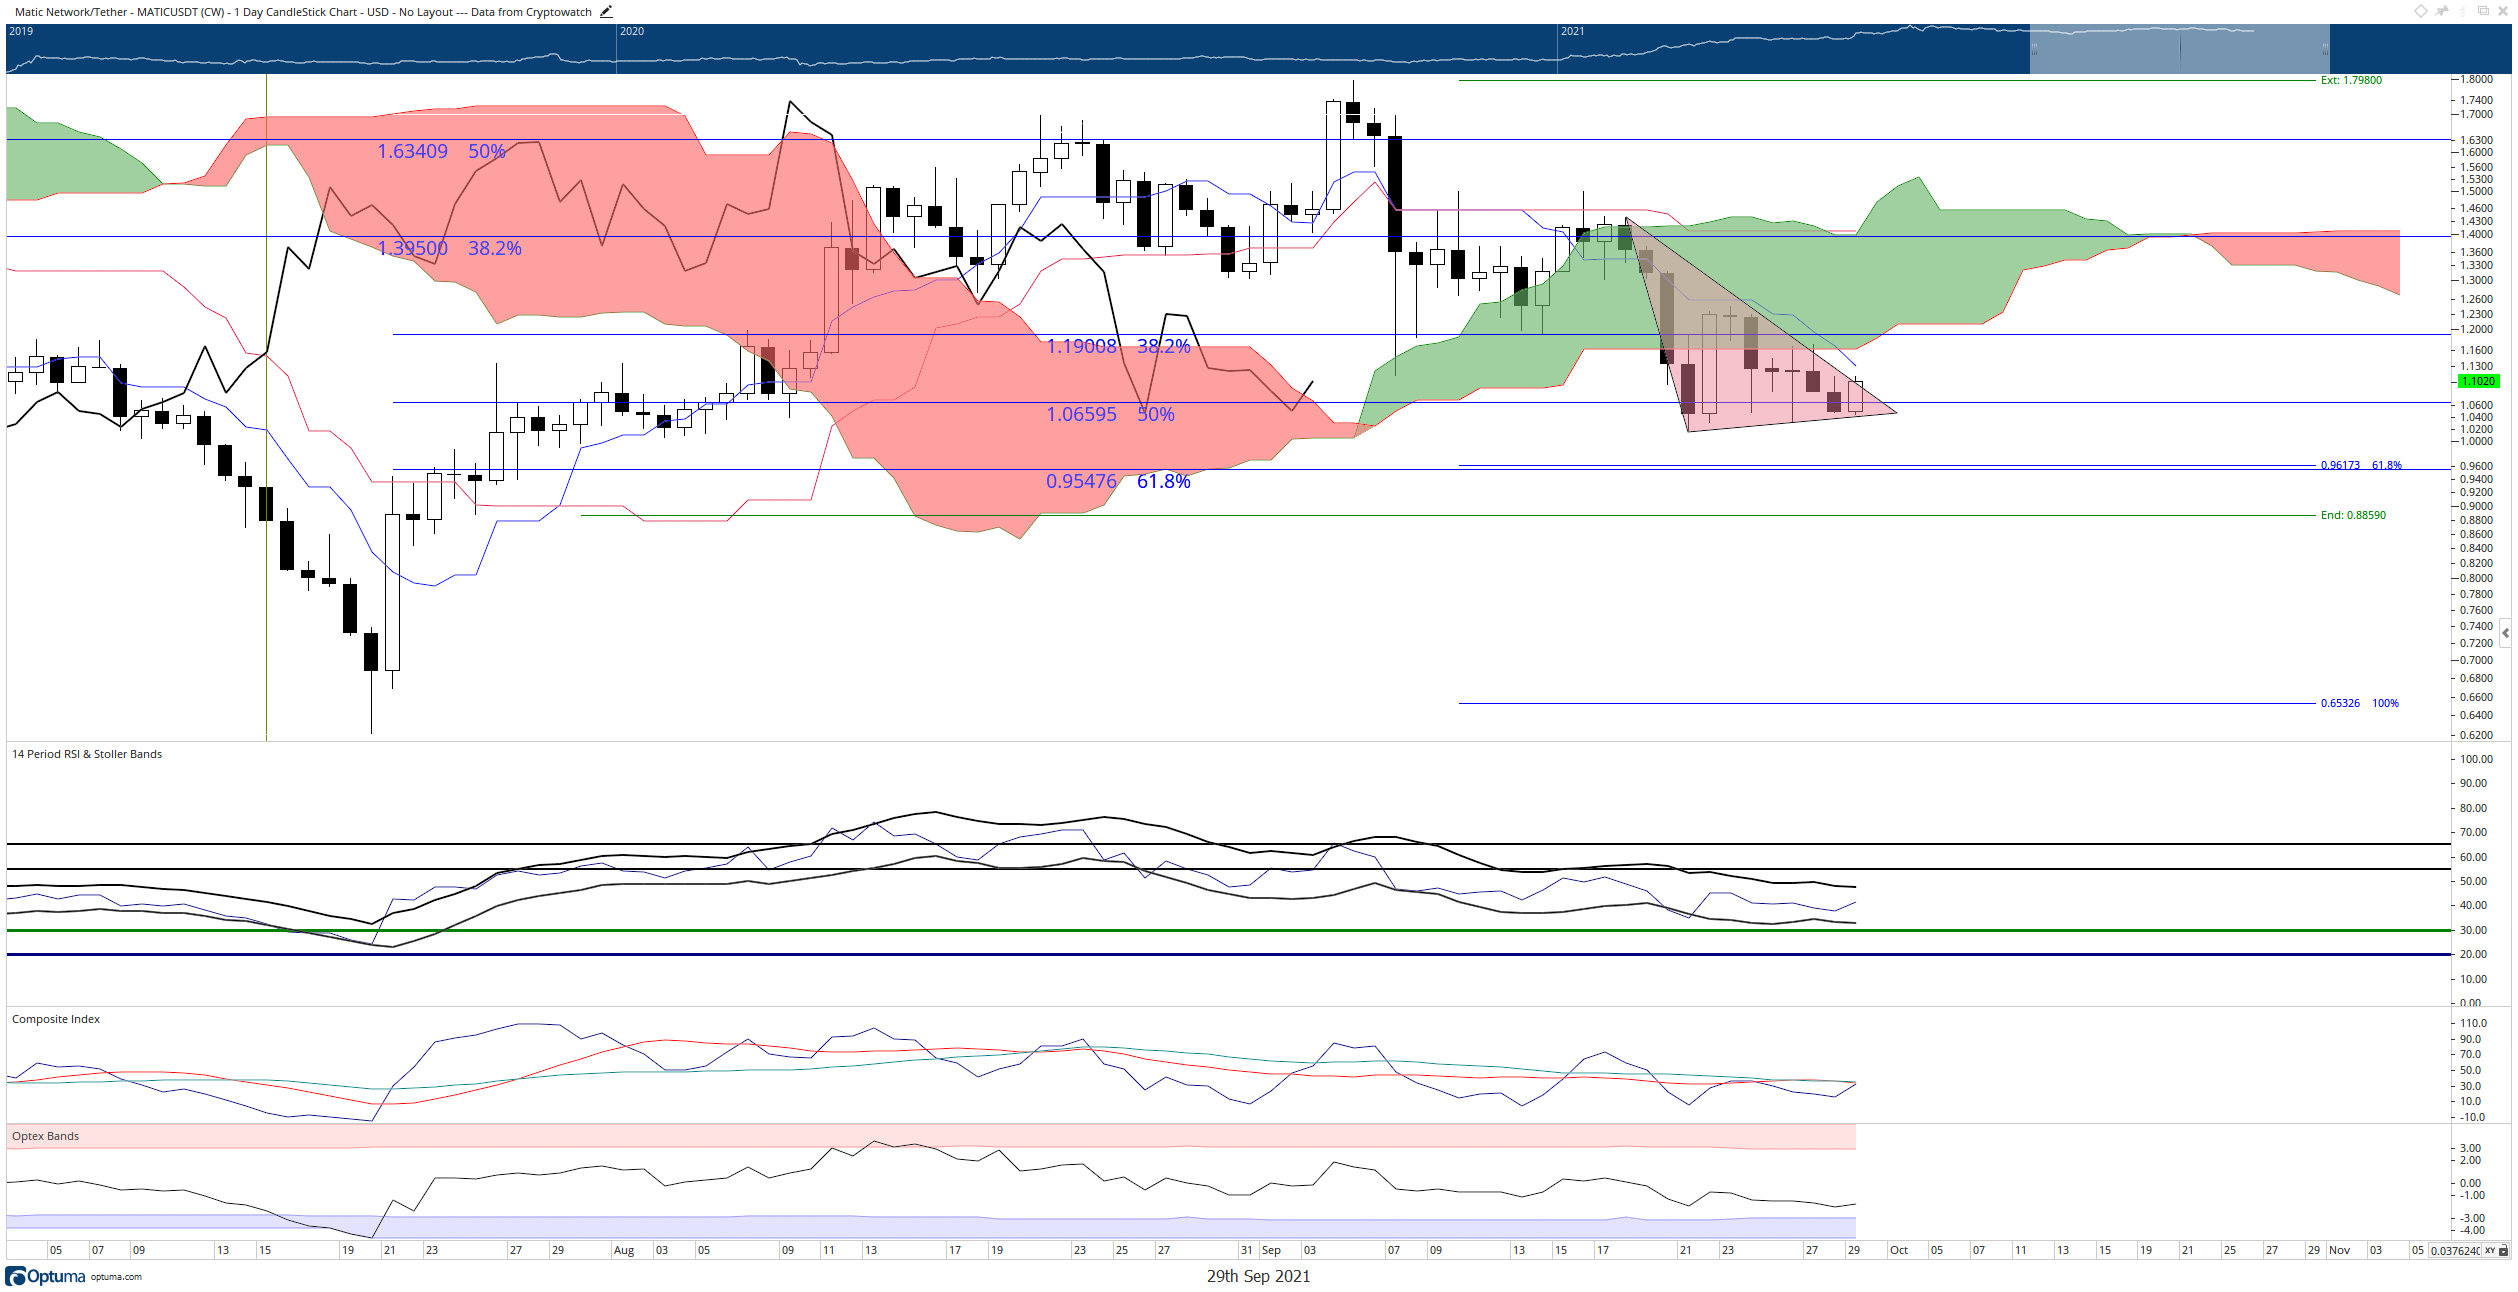
MATIC/USD Daily Ichimoku Chart
If traders want to see a return to sustained growth in MATIC price value, then a close above $1.18 is just the beginning. After that, buyers will have to support MATIC price even higher to a close above $1.75 – which is very unlikely given the current environment. Bulls shouldn't lose hope though, as the threshold to convert MATIC into a clear and sustained bull market drops from $1.75 to $1.43 on October 12th.
Like this article? Help us with some feedback by answering this survey:
Author

Jonathan Morgan
Independent Analyst
Jonathan has been working as an Independent future, forex, and cryptocurrency trader and analyst for 8 years. He also has been writing for the past 5 years.


