MATIC price to drop another 35% and test $0.85 as support
- MATIC price drops back below the 2021 VPOC, signaling weakness.
- Bear flag signals continuation move south.
- A Target zone of $0.85 could create a very bullish setup.

Polygon’s price has not been immune to the weakness across the entire cryptocurrency market. Before the flash crash on Tuesday, MATIC has struggled to maintain any trending price moves above the psychological price point of $1.50. The consistent rejection against $1.40 is now a warning signal that lower prices are incoming.
MATIC price action suggests a strong move south, could trade below the $1.00 range
The 2021 VPOC (Volume Point-Of-Control) sits at $1.42 and has acted as the primary resistance level for MATIC. The current pattern on the $0.05/3-box reversal Point and Figure chart is forming a Bull Trap. A double-bottom will start if the recent column of Os falls to $1.20. One more box below $1.18 would likely trigger a continued drop towards the 100% Fibonacci expansion at $0.85.
For long-term bulls and hodlers, a drop to $0.85 may be a fortuitous development. The right shoulder of an inverse head-and-shoulder pattern could likely find its bottom upon reaching $0.85. Coincidentally, an expected breakout aboe the neckline in the future would coincide with a breakout above the 2021 VPOC and will likely usher in a significant, new bull phase.
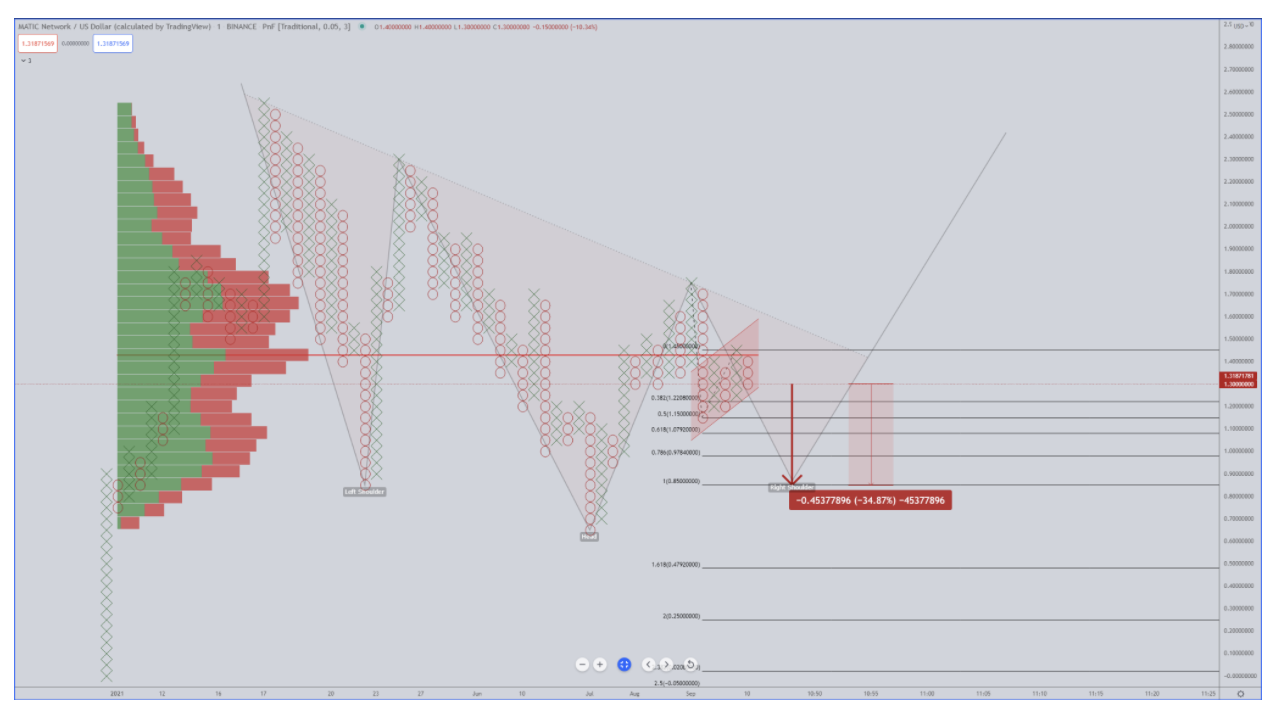
MATIC/USD chart
In the near term, bears will want to be cautious of a clear return to the $1.55 value area as this would invalidate the current Bull Trap Point and Figure pattern. Any near-term bearish outlook will be effectively terminated if MATIC price drives up to $1.80.
Bulls and bears will want to pay special attention to MATIC price behavior if it returns to $0.85. The 161.8% Fibonacci expansion at $0.48 is an easy target for bears to reach. The volume profile thins out considerably below $0.85. This means that the MATIC price has a more manageable (and faster) time moving lower than higher.
Author

Jonathan Morgan
Independent Analyst
Jonathan has been working as an Independent future, forex, and cryptocurrency trader and analyst for 8 years. He also has been writing for the past 5 years.