MATIC Price Forecast: Polygon upside potential limited as whales continue to vanish
- MATIC price has been able to break above the prevailing falling wedge pattern, aiming for a higher high.
- However, the uptrend was halted as a sell signal was produced, pushing Polygon price back to support at the 50 four-hour moving average.
- The MATIC supply distribution metric raises concern for the asset as whale addresses have declined for the past month.

MATIC price has continued to record lower highs as part of the consolidation that has consumed the asset since May 26. Now, Polygon has attempted to break out of the falling wedge pattern but has found itself struggling to sustain the uptrend as whales have not been buying.
MATIC price struggles to sustain the breakout
MATIC price has been sealed in a tight range while consolidating in a falling wedge pattern since late May. The Ethereum scaling solution tried to retest its all-time high but failed to sustain the bullish momentum, producing lower lows and lower highs.
Now, on the 4-hour chart, MATIC price is struggling to sustain its breakout above the upper boundary of the falling wedge pattern, coinciding with the 50 four-hour moving average that is acting as the first line of defense.
Although Polygon breaking out above the pattern would confirm accelerating interest, MATIC price was met with a sell signal given by the Momentum Reversal Indicator (MRI) that would determine the local top for the asset, prompting a swift reversal of fortune.
MATIC price has limited upside potential due to the numerous obstacles ahead, including the 38.2% Fibonacci extension level at $1.48, which is met with the resistance line given from MRI.
The 100 four-hour moving average and the 200 four-hour moving average also acts as stiff resistance ahead for Polygon, at $1.60, where the two indicators clash. Speculators should also note that the 100 four-hour moving average is now dipping slightly below the 200 four-hour moving average, raising concern for MATIC price.
Should the asset find itself losing the 50 four-hour moving average at the current $1.44 level as support, MATIC could fall to the 27.2% Fibonacci retracement level at $1.27 before lodging itself in the demand zone that ranges from $0.94 to $1.22.
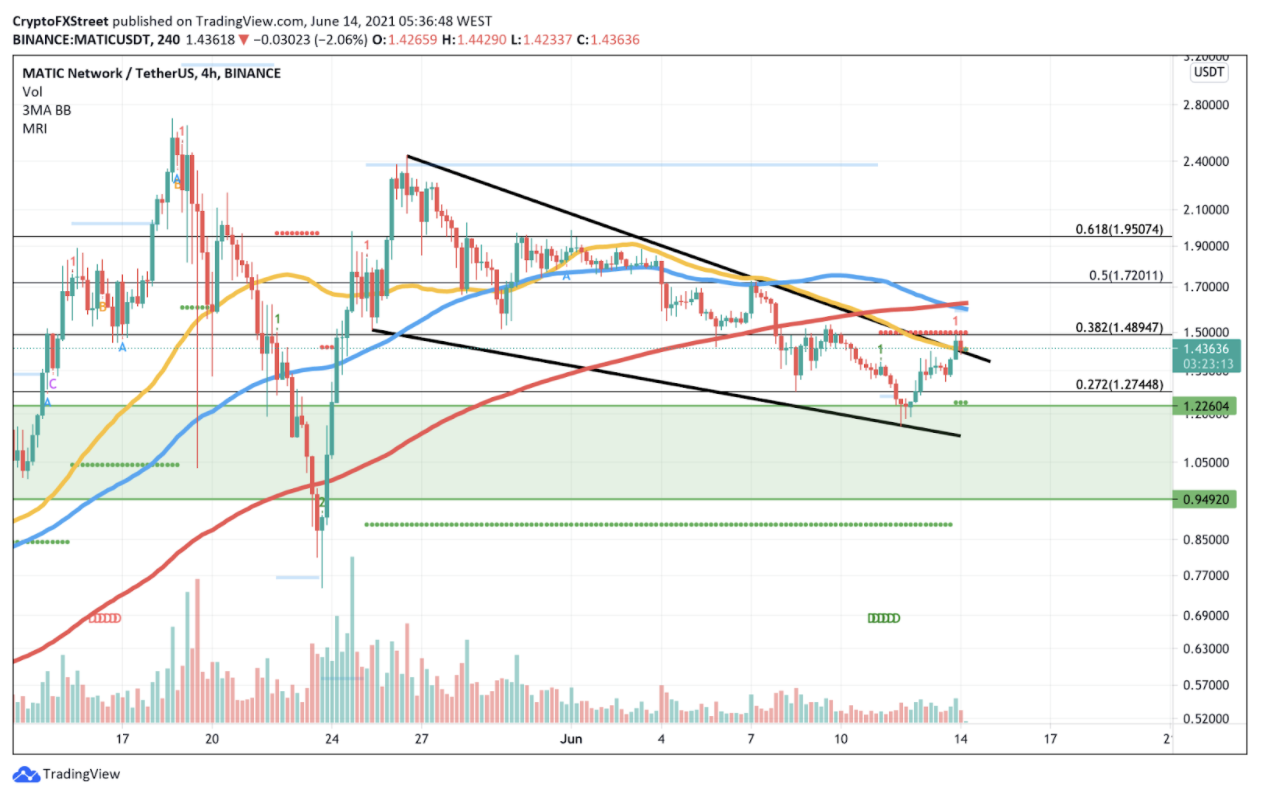
MATIC/USDt 4-hour chart
The decline in Polygon whales also presents a significant concern for the asset, as MATIC holders with 10,000 to 1,000,000 coins have been steadily decreasing since mid-May.
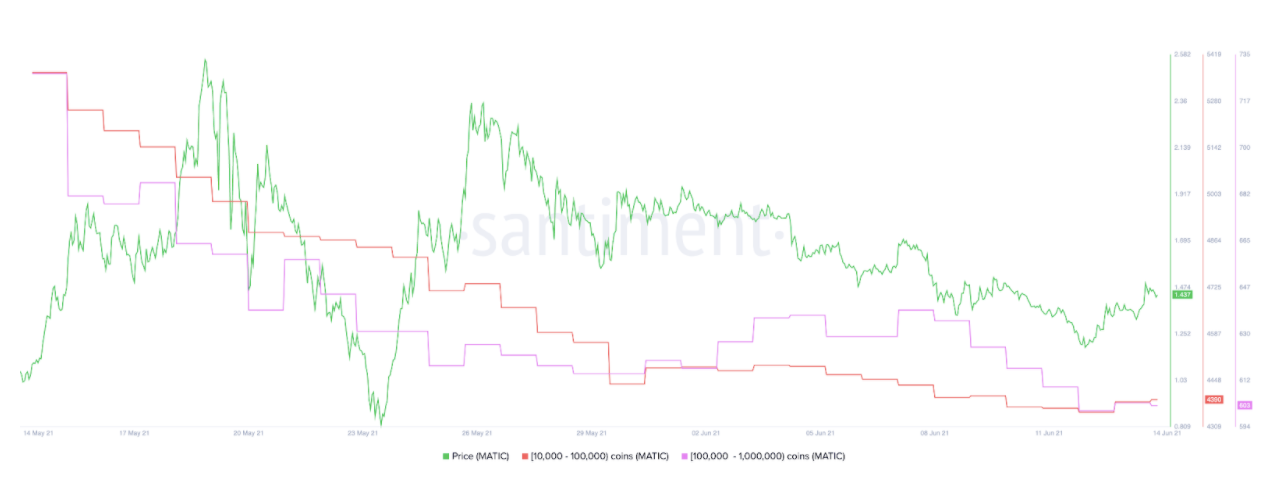
MATIC Whales
However, speculators should not lose hope in the longer-term price action. Conversely, retail investors with less than 1,000 coins continued to increase, meaning that these holders have accumulated more MATIC despite the recent Polygon consolidation.
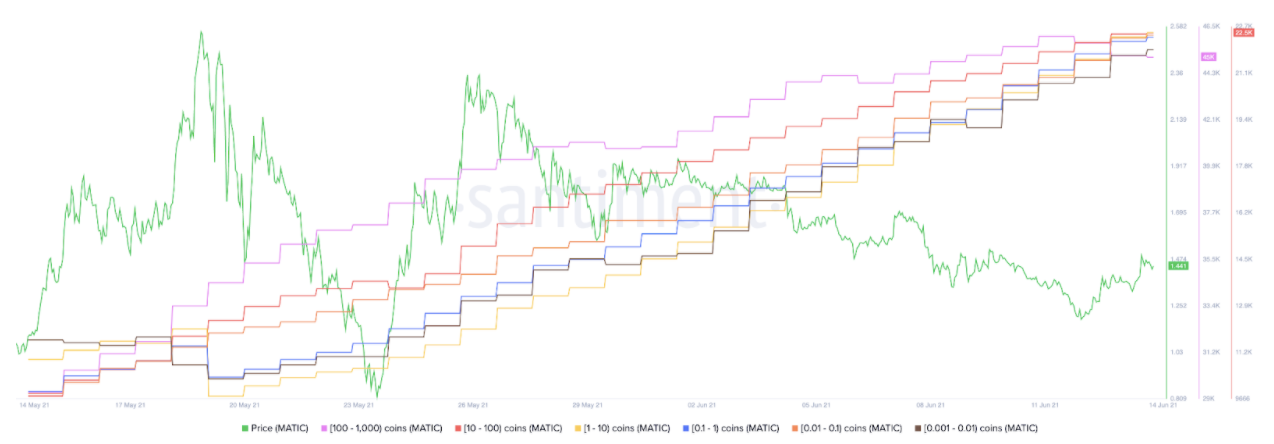
MATIC Supply Distribution
Unless a significant wave of buying pressure overtakes MATIC price, Polygon could continue to consolidate further before reversing the period of underperformance.
Author

Sarah Tran
Independent Analyst
Sarah has closely followed the growth of blockchain technology and its adoption since 2016.


