MATIC price ready to surge to $2.20 as Polygon trend reverses
- MATIC price continues on a downward trend after the recent breakout to the upside following the May market crash.
- While the trading volume of Polygon has been in decline, the scaling solution could be anticipating a sharp trend reversal.
- The falling wedge pattern suggests that MATIC could see a rally of 44% of buying pressure rises.

MATIC price has been slowly declining and is down by 42% following the swift rebound to the reaction high of $2.43 from the May correction. While Polygon price action appears to be heading south, the Ethereum-based scaling cryptocurrency is raising the probability of a sharp trend reversal to the upside.
MATIC price action raises the probability of a substantial move
MATIC price has continued to lead a downward trend since May 26, printing lower highs and lower lows. On the daily chart, Polygon appears to be forming a falling wedge pattern, that begins wide at the top and contracts as the prices move lower.
MATIC price action forms a cone that slopes down as the reaction highs and reaction lows converge, creating the bullish chart pattern.
The lower trend line suggests that MATIC is forming shallower lows – indicating a decrease in selling pressure with a less negative tilt formed.
The lighter Polygon trading volume also suggests that it could be anticipating a breakout.
The potential rally of MATIC can be measured from the vertical distance between the support and resistance at the starting point of the descending wedge pattern. This measurement can then be added to the breakout point of the pattern, to give Polygon two possible targets.
If the pattern is robust, it can be used to anticipate price moves. According to the measurement on the technical analysis, MATIC could rally by 30%, reaching $1.95, coinciding with the 61.8% Fibonacci extension level as a conservative target.
Should Polygon be met with a huge spike in buying pressure, MATIC could surge by over 44%, reaching $2.17.
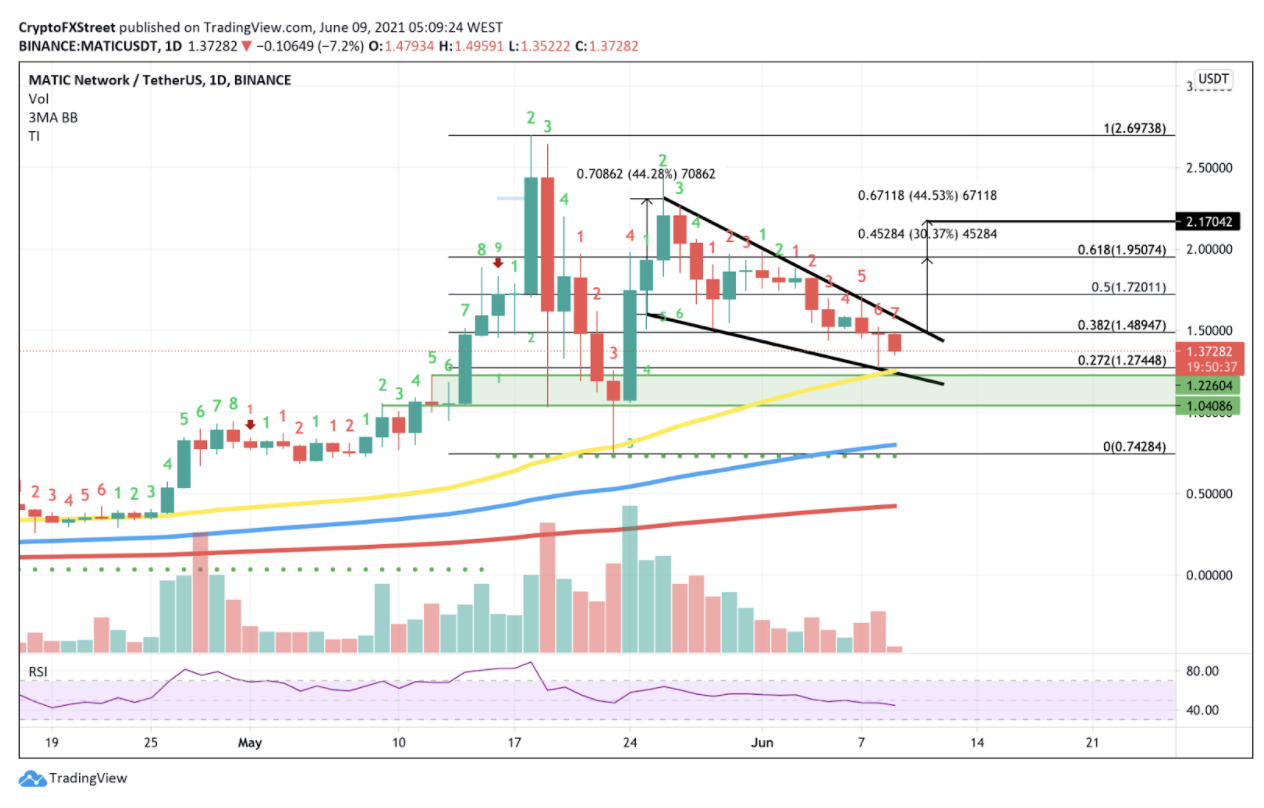
MATIC/USDt 1-day chart
The TI indicator on the daily also shows that MATIC is currently on the seventh consecutive day in decline, adding credence to the bullish thesis that Polygon could soon see a trend reversal in the next few days.
However, this bullish bias cannot be realized until a resistance breakout occurs above the topside trendline.
Investors should turn their attention to the critical support levels if the downside momentum continues. The 50-day moving average currently acts as the first line of defense, coinciding with the lower trend line of the chart pattern.
If MATIC loses its first critical support at $1.24, Polygon could swing below, and trade in the demand zone, ranging from $1.04 to $1.22.
Author

Sarah Tran
Independent Analyst
Sarah has closely followed the growth of blockchain technology and its adoption since 2016.


