MATIC price eyes 5% climb amid reports that Polygon gained over 15 million new users last year


  • Polygon price is nurturing an uptrend with a pending buy signal on the RSI.
  • MATIC could extend the climb 5% to confront the 100-day SMA at $0.8029.
  • Invalidation of bullish outlook will occur if the price breaks and closes below $0.7390
  • Reports indicate that Polygon gained more than 15 million new users in 2023.

Polygon (MATIC) price is attempting a recovery rally after a prolonged downtrend. The bulls appear to be making a comeback, despite overhead pressure, but a lot depends on how the bulls will react to the pending buy signal.

Also Read: MATIC price eyes $0.70 despite Polygon network’s plans to launch blockchain aggregation layer

Polygon on-boarded 15 million new users in 2023

Reports suggest that the Polygon chain saw up to 15 million new users join the network in 2023, a move that catapulted the blockchain to the second position, after Ethereum, on metrics of cryptocurrency adoption.

Market watchers attribute the heft to Polygon’s developing itself as the choice for builders looking for the most scalable and cost-effective Ethereum Virtual Machine (EVM) environment for their users.

Polygon price outlook

Nevertheless, Polygon price has not performed as well as its adoption metric, with overhead pressure still abounding. It sits atop the support provided by the 200-day Simple Moving Average (SMA) at $0.7024 right below the $$0.7390 critical buyer congestion level, with a pending buy signal on the Relative Strength Index (RSI). If the trajectory of this momentum indicator sustains, it could soon cross above the yellow band, which represents the signal line. Such a crossover is bullish, interpreted as a buy signal.

The ensuing buying pressure could see the Polygon price extend north to tag the 100-day SMA at $0.8029. Further north, it could move higher to confront the 50-day SMA at $0.8553. In a highly bullish case, the gains could see MATIC price reach the $0.9702 blockade.

A flip of the aforementioned barrier into support could see the Polygon price venture into the supply chain, ranging from $0.9833 to $1.0400. A break and close above the midline of this order block at $1.0135 on the daily timeframe would confirm the continuation of the uptrend.

The Moving Average Convergence Divergence (MACD) is inching north and could soon cross above its signal line. In the same way, the histogram bars of the Awesome Oscillator (AO) indicator are turning green, a sign of bulls making headway in the MATIC market.

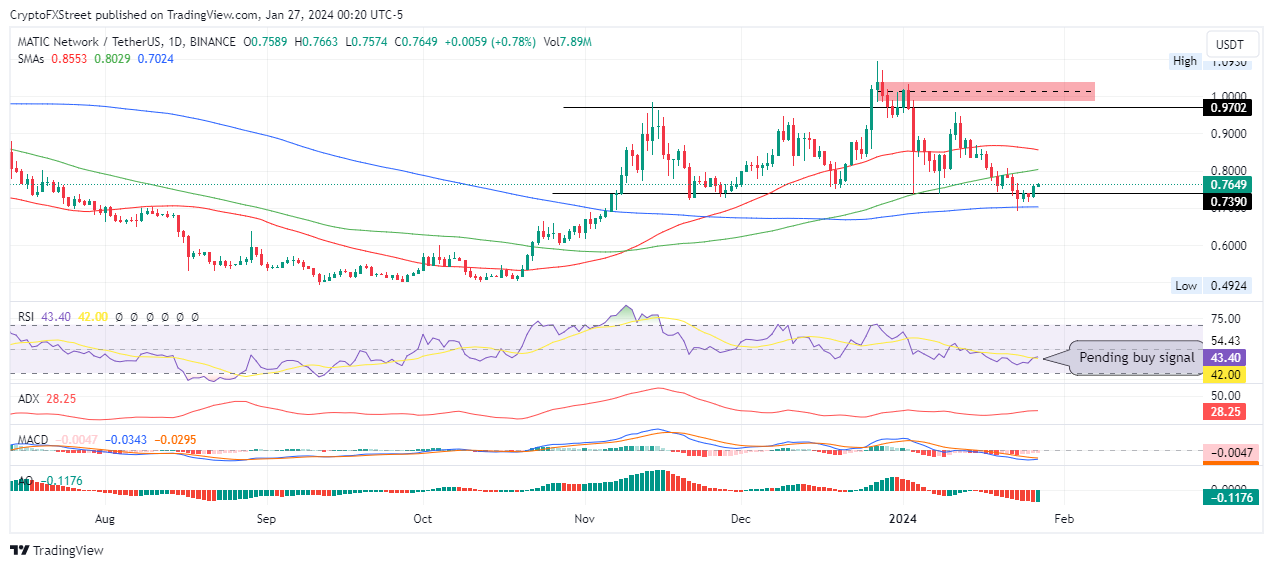
MATIC/USDT 1-day chart

On the other hand, considering both the MACD and the AO are still in negative territory, bolstered by an RSI that is below the 50 midline, the bears have a tight grip on MATIC. With this, Polygon price could yet fall, potentially losing the support at $0.7390.Such a retraction would invalidate the bullish thesis.

In the dire case, the load-shedding exercise could send MATIC price to the 200-day SMA at $0.7024, below which the $0.6000 psychological level would come into focus.  

This story was edited on January 27 at 18:00 GMT to say reports suggest that the Polygon chain saw up to 15 million new users join the network in 2023, not 202. 


Information on these pages contains forward-looking statements that involve risks and uncertainties. Markets and instruments profiled on this page are for informational purposes only and should not in any way come across as a recommendation to buy or sell in these assets. You should do your own thorough research before making any investment decisions. FXStreet does not in any way guarantee that this information is free from mistakes, errors, or material misstatements. It also does not guarantee that this information is of a timely nature. Investing in Open Markets involves a great deal of risk, including the loss of all or a portion of your investment, as well as emotional distress. All risks, losses and costs associated with investing, including total loss of principal, are your responsibility. The views and opinions expressed in this article are those of the authors and do not necessarily reflect the official policy or position of FXStreet nor its advertisers. The author will not be held responsible for information that is found at the end of links posted on this page.

If not otherwise explicitly mentioned in the body of the article, at the time of writing, the author has no position in any stock mentioned in this article and no business relationship with any company mentioned. The author has not received compensation for writing this article, other than from FXStreet.

FXStreet and the author do not provide personalized recommendations. The author makes no representations as to the accuracy, completeness, or suitability of this information. FXStreet and the author will not be liable for any errors, omissions or any losses, injuries or damages arising from this information and its display or use. Errors and omissions excepted.

The author and FXStreet are not registered investment advisors and nothing in this article is intended to be investment advice.

Join Telegram

Recommended content


Recommended Content

Editors’ Picks

Could Worldcoin price shoot up 45% ahead of OpenAI’s live stream on Monday?

Could Worldcoin price shoot up 45% ahead of OpenAI’s live stream on Monday?

Worldcoin has formed a double bottom around a key support level, suggesting a potential accumulation. If the OpenAI’s Monday live stream has a positive impact on Artificial Intelligence field, it could positively impact WLD and other AI-based tokens. 

More Worldcoin News

Here’s what needs to happen for The Graph price to revisit $0.422

Here’s what needs to happen for The Graph price to revisit $0.422

The Graph price trades inside the $0.192 to $0.494 range. Investors need to wait for GRT to overcome $0.343 before being bullish on GRT. If successful, GRT could rally 50% and revisit the $0.422 hurdle. A decisive daily candlestick close below $0.192 will invalidate the bullish thesis.

More The Graph News

SingularityNET price could bounce 30% if AGIX can hold this level

SingularityNET price could bounce 30% if AGIX can hold this level

SingularityNET price has been consolidating around the bottom of the $0.903 to $1.475 range for nearly a month. With some AI-tokens showing signs of revival, AGIX needs to be enalyzed for potential breakout opportunities like Arkham (ARKM).

More SingularityNET News

Arkham price primed for a recovery rally ahead of OpenAI’s announcement

Arkham price primed for a recovery rally ahead of OpenAI’s announcement

Arkham price eyes a potential reversal as it clears key hurdles. ARKM likely to rally 27% if it can overcome $2.74 resistance level. A breakdown of $2.28 wil invalidate the bullish thesis for the AI-based token.

More Arkham News

Bitcoin: Why BTC is close to a bottom

Bitcoin: Why BTC is close to a bottom

Bitcoin (BTC) price efforts of a recovery this week have been countered by selling pressure during the onset of the American session. However, the downside potential appears to have been capped. Markets have noted significant trading differences between sessions, and while the Asian market showed strength, whatever ground they were able to cover was oftentimes wiped out by traders in the US.

Read full analysis

BTC

ETH

XRP