MATIC Price Analysis: Polygon braces for short term challenges
- MATIC price structure lacks clarity as it is no longer shaping a cup-with-handle base.
- Daily volume continues to run around 35% of the 50-day average, flagging a lack of engagement from the investor base.
- IntoTheBlock IOMAP metric reveals that Polygon confronts considerable resistance close to the current price level.

MATIC price strength was a positive highlight during the May correction, despite the plunge of 75%. Polygon registered an extraordinary rebound of 230% from the correction low on May 23, extending the negative correlation with Bitcoin. For a time, the digital asset was proceeding with the formation of a cup-with-handle base, but the clarity of the price structure has diminished.
MATIC price low volume and notable price contraction tend to proceed substantial moves
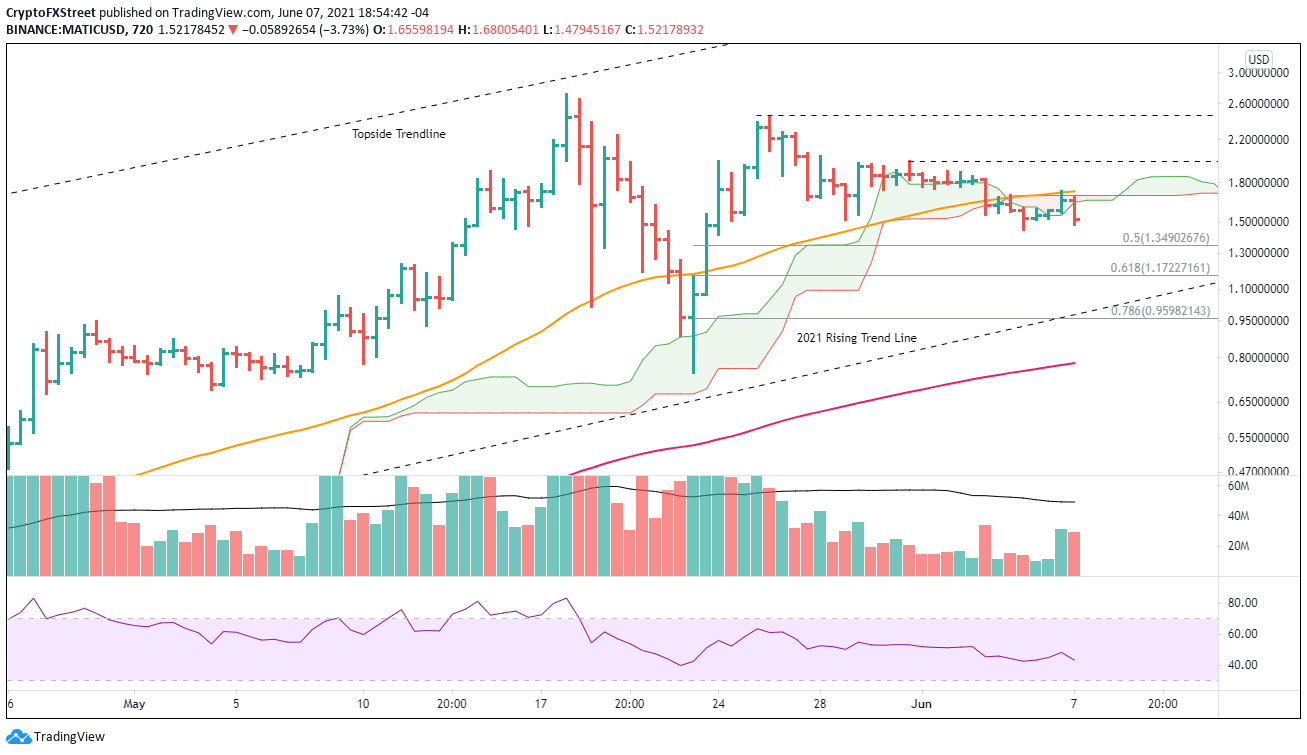
As leading cryptocurrencies should do, MATIC price rebounded 230% from the May 23 low, quickly establishing the technical foundation for a cup-with-handle base. The base evolution was consistent with success. The right side of the cup was flashing above-average volume, with the handle primarily forming in the upper half of the base on increasingly lighter volume. The lighter Polygon volume indicated that weak holders had been evacuated from the token, raising the probability of a sustainable breakout.
The base had a trigger price of $2.48, the high of the handle, and due to the compressed right side of the cup, it was anticipated that the handle would extend to release the compression. The measured move target of the Polygon cup-with-handle base was $8.20, yielding a 230% gain from the handle high for investors.
Over the last few days, MATIC price has drifted lower, albeit remaining in the top half of the base structure, but the handle is far too long, disrupting the symmetry of the base and removing clarity.
MATIC price now trades below the 50 twelve-hour moving average at $1.73 and the Ichimoku cloud, translating into overhead resistance that will require above-average volume totals to overcome.
Today, MATIC price is at risk of a deeper pullback that could extend to the 61.8% Fibonacci retracement of the May rebound at $1.17. If weakness in the cryptocurrency complex accelerates, as anticipated, Polygon could reach the crossing of the 2021 rising trend line currently at $0.99 with the 78.6% retracement at $0.95.
MATIC/USD 12-hour chart
Alternatively, MATIC price could overcome the resistance mentioned earlier and deliver a double bottom on the intraday charts with a trigger of $1.98. Polygon could resume the rally, taking out the May 26 high at $2.44 and then test the all-time high at $2.71.
Additional upside targets to be considered at new highs.
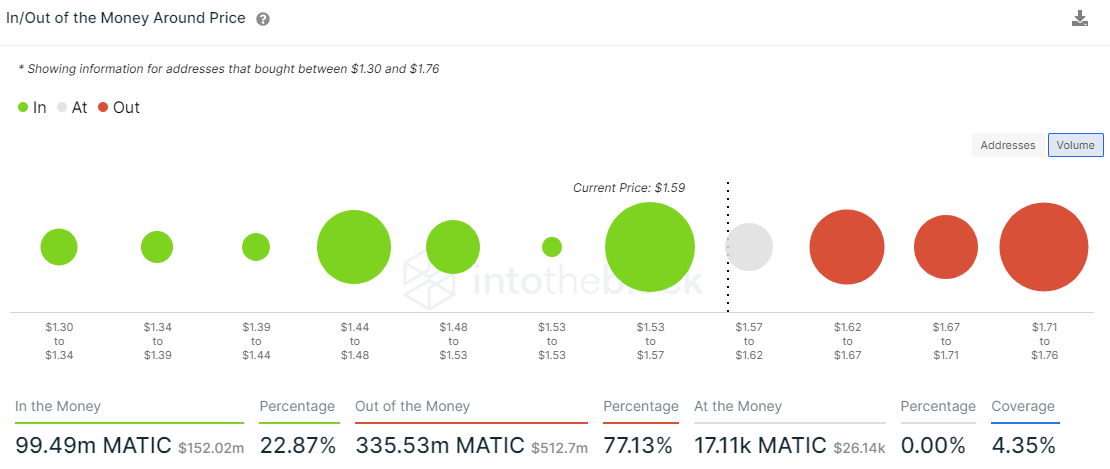
In terms of on-chain metrics, the IntoTheBlock In/Out of the Money Around Price (IOMAP), a crypto-native metric of support and resistance, reveals that MATIC price faces formidable opposition (out of the money) between $1.62 and $1.76, where 13.29k addresses hold 209.91 million MATIC. The range overlaps very closely with the Ichimoku cloud and the 50 twelve-hour SMA.
On the downside, MATIC price does not show much support (in the money), down to $1.30. The cluster between $1.44 to $1.48 where 217 addresses hold 63.99 million MATIC could offer temporary support. The $1.53-$1.57 support has already been overcome today.
MATIC IOMAP - IntoTheBlock
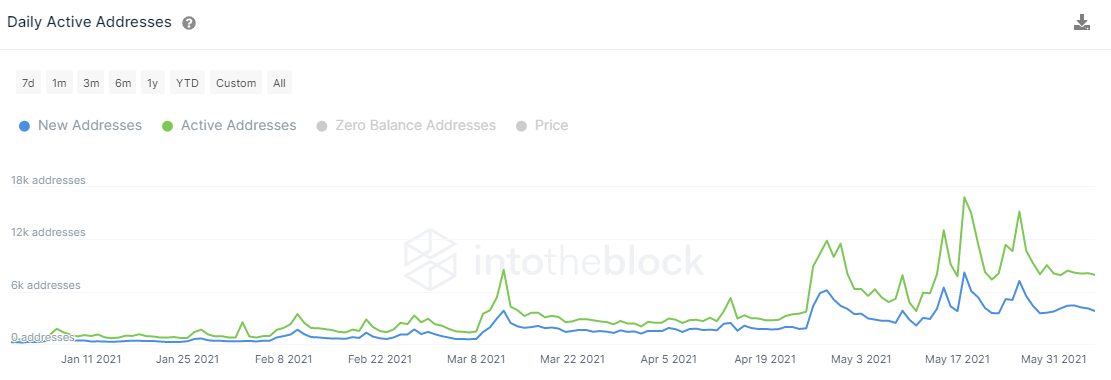
It is no surprise that Polygon has experienced high levels of network growth in 2021, with Daily Active Addresses (DAA) up almost 13x from the beginning of the year. Since the end of May, the number has flatlined, suggesting that the recent general cryptocurrency weakness and uncertainty are not shaking the conviction of Polygon investors.
Such growth and activity reflect the growing number of innovative companies that are part of the ecosystem, including AAVE, 1Inch and Sushiswap. They have grown their offering to Polygon to sidestep the overwhelming congestion currently emblematic of the Ethereum blockchain.
MATIC Daily Active Addresses (DAA) - IntoTheBlock
As the IOMAP metric highlights, Polygon investors are best served in the short term with a patient approach to let the layers of resistance be surpassed. They should use sizeable weakness around key support levels mentioned above as opportunities to accumulate.
No doubt, the impressive MATIC price performance in 2021 has shown that a digital asset supported by a rapidly growing fundamental story can achieve an exceptional level of relative strength against not only the general market but also Bitcoin. The cryptocurrency should continue to reach higher highs in the long term unless there is a sudden decline in usage or a persistent drop in Ethereum transaction costs.
Author

Sheldon McIntyre, CMT
Independent Analyst
Sheldon has 24 years of investment experience holding various positions in companies based in the United States and Chile. His core competencies include BRIC and G-10 equity markets, swing and position trading and technical analysis.



