Manta Network Price Prediction: 10% losses likely as MANTA teases with a possible sell signal


  • Manta Network price remains in the upper half of the Bollinger indicator above the centerline at $3.1428.
  • MANTA could fall 10% amid falling momentum, with a pending sell signal on the H2 timeframe.
  • Invalidation of the bearish thesis will occur if the price creates a higher high above $3.5165.

Manta Network (MANTA) price remains broadly bullish, but things could change soon amid falling momentum that teases with a pending sell signal.

Also Read: Top three altcoins trending in crypto social media: Ethereum, Dogecoin, Ondo

Manta price coukl find strong support after a 10% fall

Manta Network price is trading with a bullish bias on the 2-hour timeframe, overperforming above an ascending trendline. It remains in the top half of the Bollinger indicator, between the centerline and the upper band at $4.1428 and $3.3544 levels respective.

Based on the outlook of the Relative Strength Index (RSI), momentum is falling, and could soon record a bearish crossover, cutting through the signal line (yellow band) to the south. With such a crossover deemed a sell signal, the Manta Network price could lose the support offered by the centerline at $3.1428, likely recording a 10% downswing from current levels, to find strong support between the confluence of the ascending trendline and horizontal support at $2.8194.

In the dire case, MANTA price could roll over to the $2.6024 support level, nearly 23% below the current price.

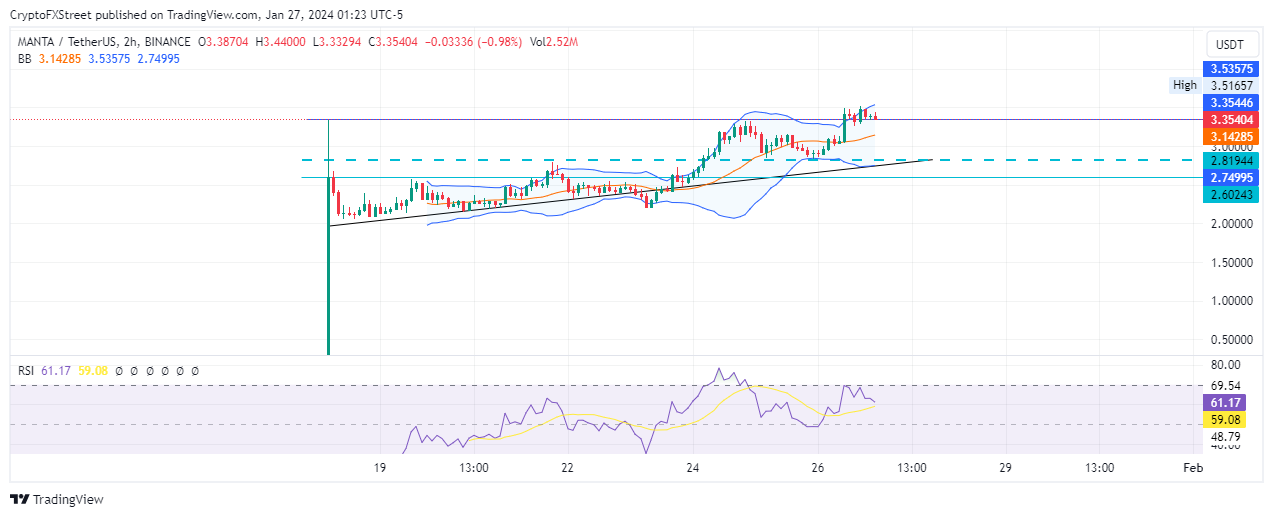
MANTA/USDT 2-hour chart

On the other hand, with the RSI at 61, the price strength is positive with more room north before MANTA can be considered overbought at 70. With this, enhanced buyer momentum could send Manta Network price north, shattering past the upper band of the Bollinger indicator at $3.3544.

For the bearish thesis to be invalidated, however, Manta Network price must clear the range high at $3.5165 and record a higher high above it.


Information on these pages contains forward-looking statements that involve risks and uncertainties. Markets and instruments profiled on this page are for informational purposes only and should not in any way come across as a recommendation to buy or sell in these assets. You should do your own thorough research before making any investment decisions. FXStreet does not in any way guarantee that this information is free from mistakes, errors, or material misstatements. It also does not guarantee that this information is of a timely nature. Investing in Open Markets involves a great deal of risk, including the loss of all or a portion of your investment, as well as emotional distress. All risks, losses and costs associated with investing, including total loss of principal, are your responsibility. The views and opinions expressed in this article are those of the authors and do not necessarily reflect the official policy or position of FXStreet nor its advertisers. The author will not be held responsible for information that is found at the end of links posted on this page.

If not otherwise explicitly mentioned in the body of the article, at the time of writing, the author has no position in any stock mentioned in this article and no business relationship with any company mentioned. The author has not received compensation for writing this article, other than from FXStreet.

FXStreet and the author do not provide personalized recommendations. The author makes no representations as to the accuracy, completeness, or suitability of this information. FXStreet and the author will not be liable for any errors, omissions or any losses, injuries or damages arising from this information and its display or use. Errors and omissions excepted.

The author and FXStreet are not registered investment advisors and nothing in this article is intended to be investment advice.

Join Telegram

Recommended content


Recommended Content

Editors’ Picks

Could Worldcoin price shoot up 45% ahead of OpenAI’s live stream on Monday?

Could Worldcoin price shoot up 45% ahead of OpenAI’s live stream on Monday?

Worldcoin has formed a double bottom around a key support level, suggesting a potential accumulation. If the OpenAI’s Monday live stream has a positive impact on Artificial Intelligence field, it could positively impact WLD and other AI-based tokens. 

More Worldcoin News

Here’s what needs to happen for The Graph price to revisit $0.422

Here’s what needs to happen for The Graph price to revisit $0.422

The Graph price trades inside the $0.192 to $0.494 range. Investors need to wait for GRT to overcome $0.343 before being bullish on GRT. If successful, GRT could rally 50% and revisit the $0.422 hurdle. A decisive daily candlestick close below $0.192 will invalidate the bullish thesis.

More The Graph News

SingularityNET price could bounce 30% if AGIX can hold this level

SingularityNET price could bounce 30% if AGIX can hold this level

SingularityNET price has been consolidating around the bottom of the $0.903 to $1.475 range for nearly a month. With some AI-tokens showing signs of revival, AGIX needs to be enalyzed for potential breakout opportunities like Arkham (ARKM).

More SingularityNET News

Arkham price primed for a recovery rally ahead of OpenAI’s announcement

Arkham price primed for a recovery rally ahead of OpenAI’s announcement

Arkham price eyes a potential reversal as it clears key hurdles. ARKM likely to rally 27% if it can overcome $2.74 resistance level. A breakdown of $2.28 wil invalidate the bullish thesis for the AI-based token.

More Arkham News

Bitcoin: Why BTC is close to a bottom

Bitcoin: Why BTC is close to a bottom

Bitcoin (BTC) price efforts of a recovery this week have been countered by selling pressure during the onset of the American session. However, the downside potential appears to have been capped. Markets have noted significant trading differences between sessions, and while the Asian market showed strength, whatever ground they were able to cover was oftentimes wiped out by traders in the US.

Read full analysis

BTC

ETH

XRP