Maker primed for a 15% rally if successfully holds key support
- Maker price 11% rally on Wednesday suggests a larger bullish move might be in the works.
- On-chain data shows that a buy-side liquidity sweep occurred before a return in investor interest.
- Investors could reaccumulate MKR if it falls between $2,225 and $2,294, the bullish order block area.
- A daily candlestick close below $2,068 would invalidate the bullish thesis.

Maker's (MKR) price trades on the backfoot on Thursday after surging 11% the day before, and it is likely to retrace its to key support. On-chain data reveals a buy-side liquidity sweep that cleared leveraged long positions and initiated new buys before MKR embarked on an upward rally.
Maker price shows bullish potential
Maker price broke above the descending trendline, drawn from joining the three swing high points from mid-May to mid-June, and rallied 5% from the breakout point on Wednesday.
Before the breakout, a buy-side liquidity sweep had occurred, in which major market participants made large-volume trades to activate a cluster of pending buy orders at specific price levels, allowing them to enter a huge position with minimum slippage. Due to this, many over-leveraged long positions were liquidated, and fresh long positions were opened, signaling a bullish move.
Sideline buyers looking for opportunities can accumulate MKR at the daily order block area, extending from $2,225 to $2,294. A bullish order block area is where market participants, such as institutional traders, have previously placed buy orders.
If the $2,225 to $2,294 area holds, MKR could rally 15% from the $2,294 level to tag the 50% Fibonacci retracement from the May 21 high at $3,221 to the June 18 low at $2,071, at $2,646.
The Relative Strength Index (RSI) on the daily chart is rising from an oversold condition and looking to break above the mean value of 50. The Awesome Oscillator (AO) indicator is below the mean zero level. If bulls are indeed making a comeback, then both momentum indicators must maintain their positions above their respective mean levels. This development would provide additional momentum to the ongoing recovery rally.
Moreover, if Maker’s price closes above $2,646, rally could be extend an additional 22% to retest the May 21 high at $3,221.
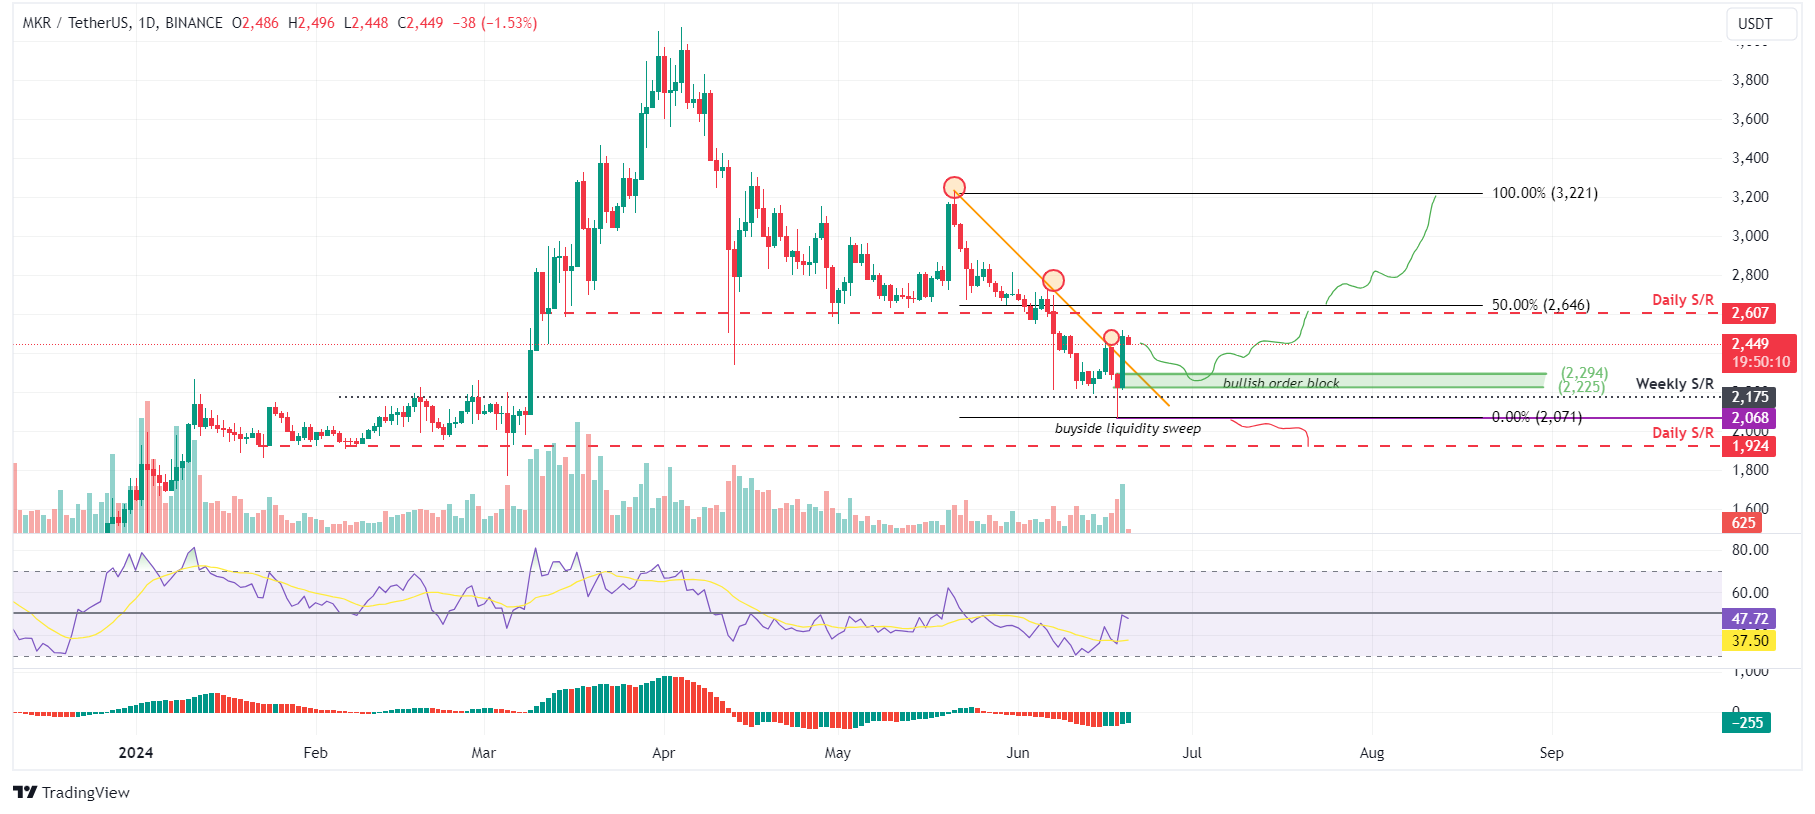
MKR/USDT 1-day chart
Based on IntoTheBlock's In/Out of the Money Map (IOMAP) metric, nearly 1,440 addresses accumulated 41,180 MRK tokens between $2,233 and $2,310, which makes it a key support zone. These investors will likely add more to their holdings if the price retraces.
Interestingly, the $2,225 to $2,294 zone mentioned from a technical analysis perspective coincides with the IOMAP findings, making this zone a key reversal zone to watch.
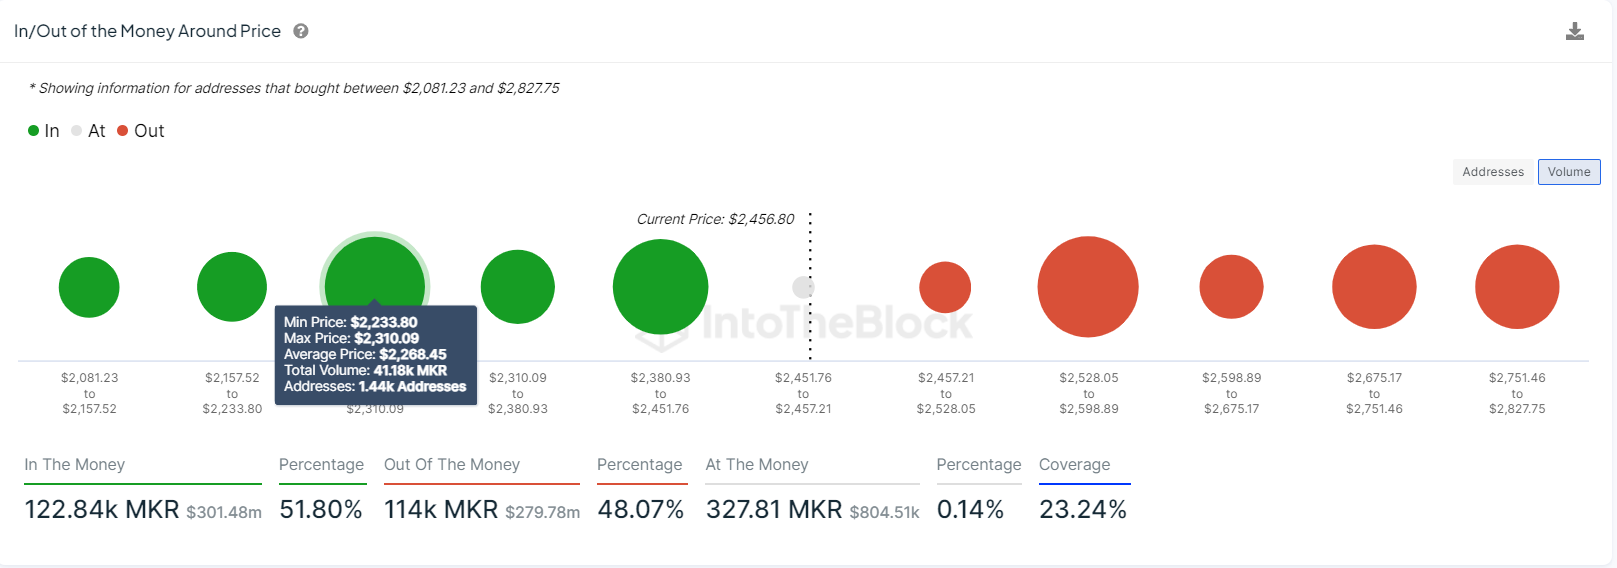
MKR IOMAP chart
Coinglass data for Liquidation shows insights into the amount and frequency of assets being forcefully sold or "liquidated" due to margin calls or other market conditions. It shows how many positions are being closed out and at what scale, giving observers an indication of market volatility and the extent of leverage traders use.
As in MKR’s case, $289,680 worth of long positions were liquidated at an average price of $2,229. This event relates to a buy-side liquidity sweep, which was mentioned from a technical analysis perspective.
Additionally, the liquid sweep event gave rise to fresh long positions, as shown by the spike in open interest from 64.46 million to 91.06 million in one day.
At the same time, the long-to-short ratio was 1.41, which means that there are 1.41 times as many long positions as short positions, further bolstering Maker's bullish outlook.
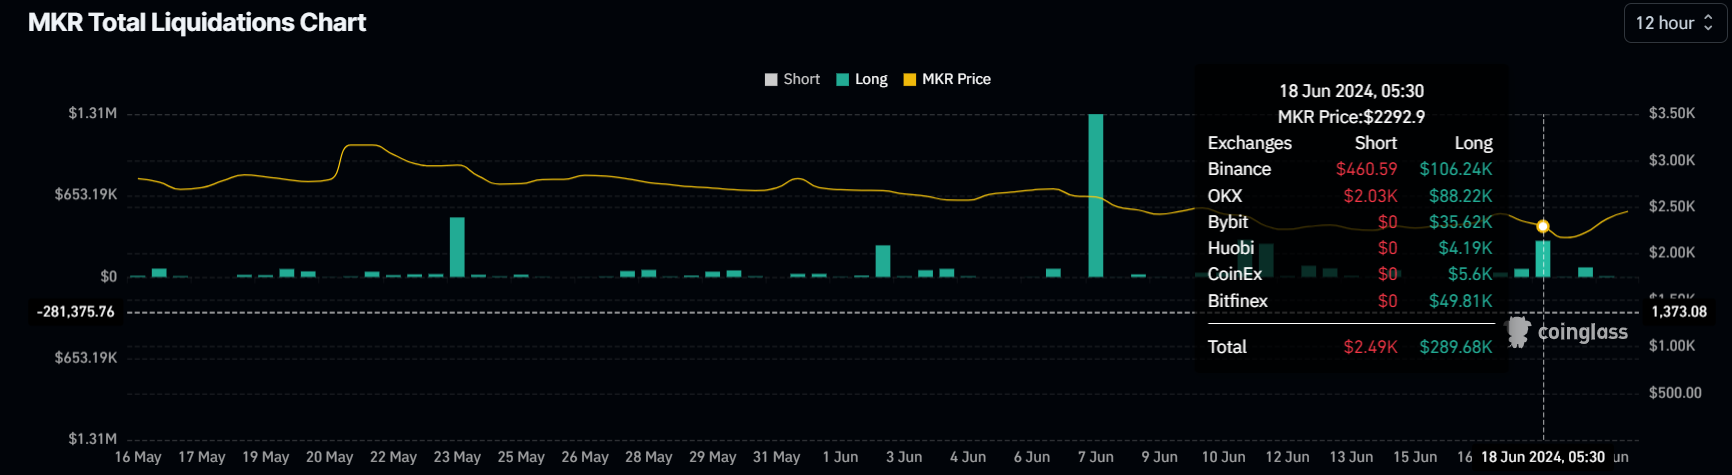
MKR Liquidation chart
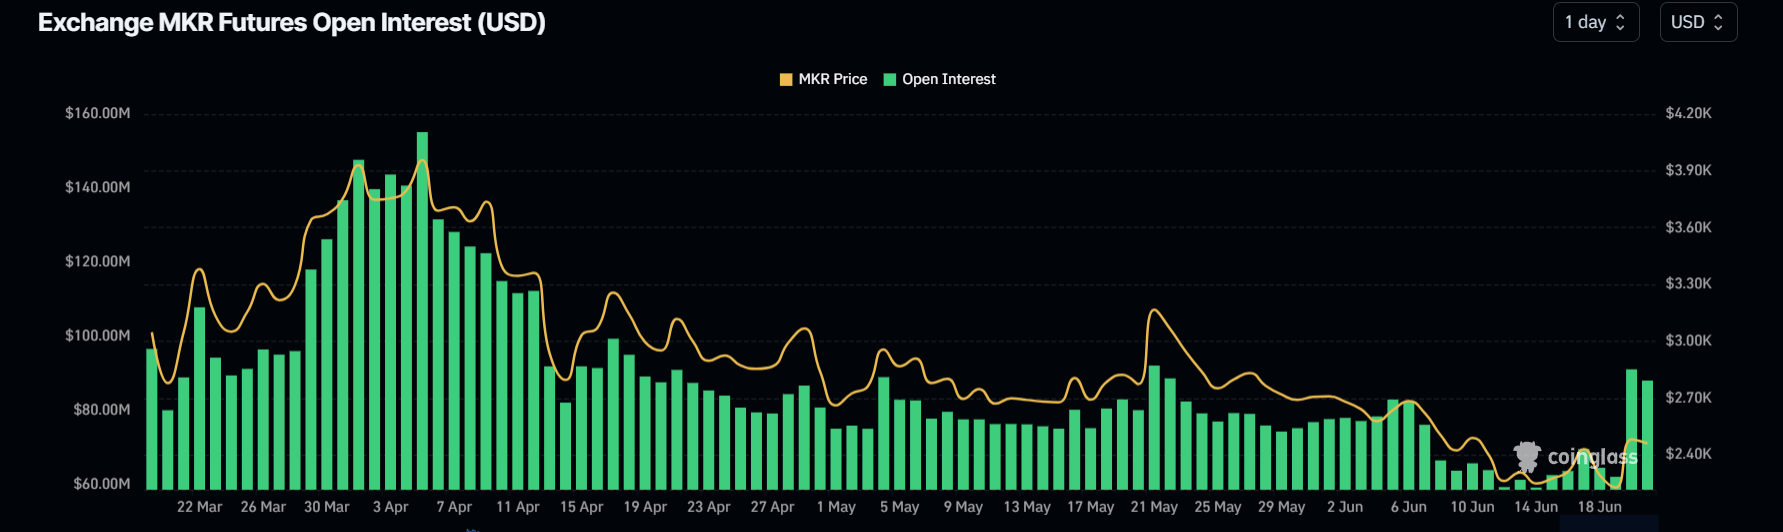
MKR Open Interest chart
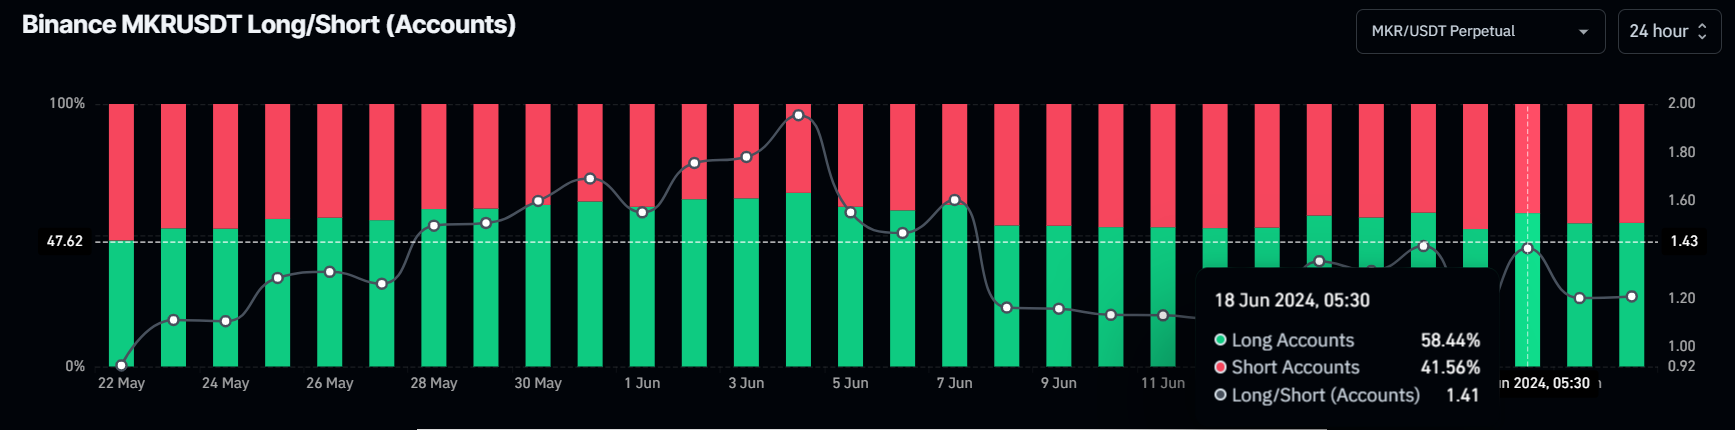
MKR Binance Long/Short ratio chart
However, if MKR's daily candlestick closes below $2,068 and establishes a lower low on the daily timeframe, it may signal a shift in market dynamics that favors bearish sentiment. Such a change could nullify the bullish outlook, leading to a 7% crash in Maker’s price to the previous daily support level of $1,924.
Author

Manish Chhetri
FXStreet
Manish Chhetri is a crypto specialist with over four years of experience in the cryptocurrency industry.


