LUNC price 11.5% sell opportunity comes after Terra Luna Classic Galactic Bounties
- LUNC price validates a bear flag pattern breakout to $2.16.
- Terra Luna Classic announces the release of its Galactic Bounties, a platform that will focus on educational and entertainment content.
- Support at the 200-day SMA could dampen the bears' efforts and allow for a bullish move to $3.00.

Terra Luna Classic price is dangerously balancing at the edge of a cliff after facing rejection at $2.55. Recovery from its most recent major low at $2.22 paved the way for gains within the confines of a rising parallel channel that has since broken down, confirming a bear flag pattern's breakout.
If buyers cannot arrest the retracement, preferably at $2.36, LUNC could be in for an extended freefall to $2.16.
Meet Terra Luna Classic's Galactic Bounties
Terra Luna Classic announced the release of Galactic Bounties, a key component of the platform's roadmap. The platform has been specifically designed to provide educational and entertainment content in the entire cosmos ecosystem while being powered by the Galactic DAO community.
According to Galactic Punks, an NFT platform within the Terra Classic ecosystem, "Bounties will be produced using a variety of mediums for maximum impact across platforms." Only the holders of Galactic Punk NFTs will have access to the Galactic Bounties' hub, while incentives will be floated to encourage the creation of the highest quality content.
Users interested in learning more about Galactic Bounties can visit Terra Luna Classic's Twitter handle, where they find a link to a Medium post explaining the program in detail.
Is this the end of the road for LUNC bulls?
The formation of a short-term bear flag pattern on the 12-hour chart hints at an 11.50% breakout. A bear flag is a continuation pattern formed by two declines separated by a short consolidation period.
A flagpole shows how strong sellers are, although buyers sweep in briefly – forming the flag ahead of the second decline. Short trades are often entered when the price slides below the lower trend line, like in the case of Terra Luna Classic, as illustrated in the chart.
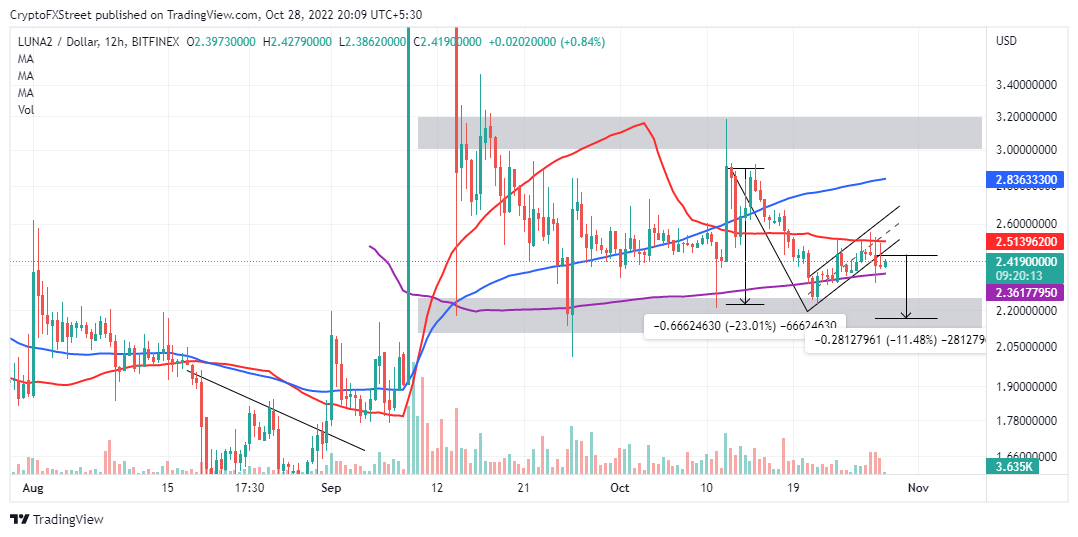
LUNC/USD 12-hour chart
This breakout tends to trigger panic selling, resulting in a spike in negative trading volume. Short positions tend to be highly profitable, with a conservative target equal to half the length of the flagpole extrapolated below the breakout point.
On the bright side, the 200-day SMA (Simple Moving Average) (in purple) holds firmly at $2.36. If LUNC price holds above this support, a return into the flag will reinforce the formation of a rising channel ahead of another bullish move to $3.00.
Author

John Isige
FXStreet
John Isige is a seasoned cryptocurrency journalist and markets analyst committed to delivering high-quality, actionable insights tailored to traders, investors, and crypto enthusiasts. He enjoys deep dives into emerging Web3 tren


