LTC/USD: Blue box shorts reached the target

LTCUSD has seen tremendous selling over the last few weeks. It recently hit 100% Fibonacci extension down from February 10, 2022 peak down to February 24, 2022 low projected lower from March 30, 2022 peak. In this article, we will look at how our members knew that rally from February 24, 2022 low to March 30, 2022 was a counter trend rally and we highlighted the selling area with a blue box for members. Members knew sellers should appear in the blue box to resume the decline for a new low below February 24, 2022 low or for 3 waves reaction lower at least.
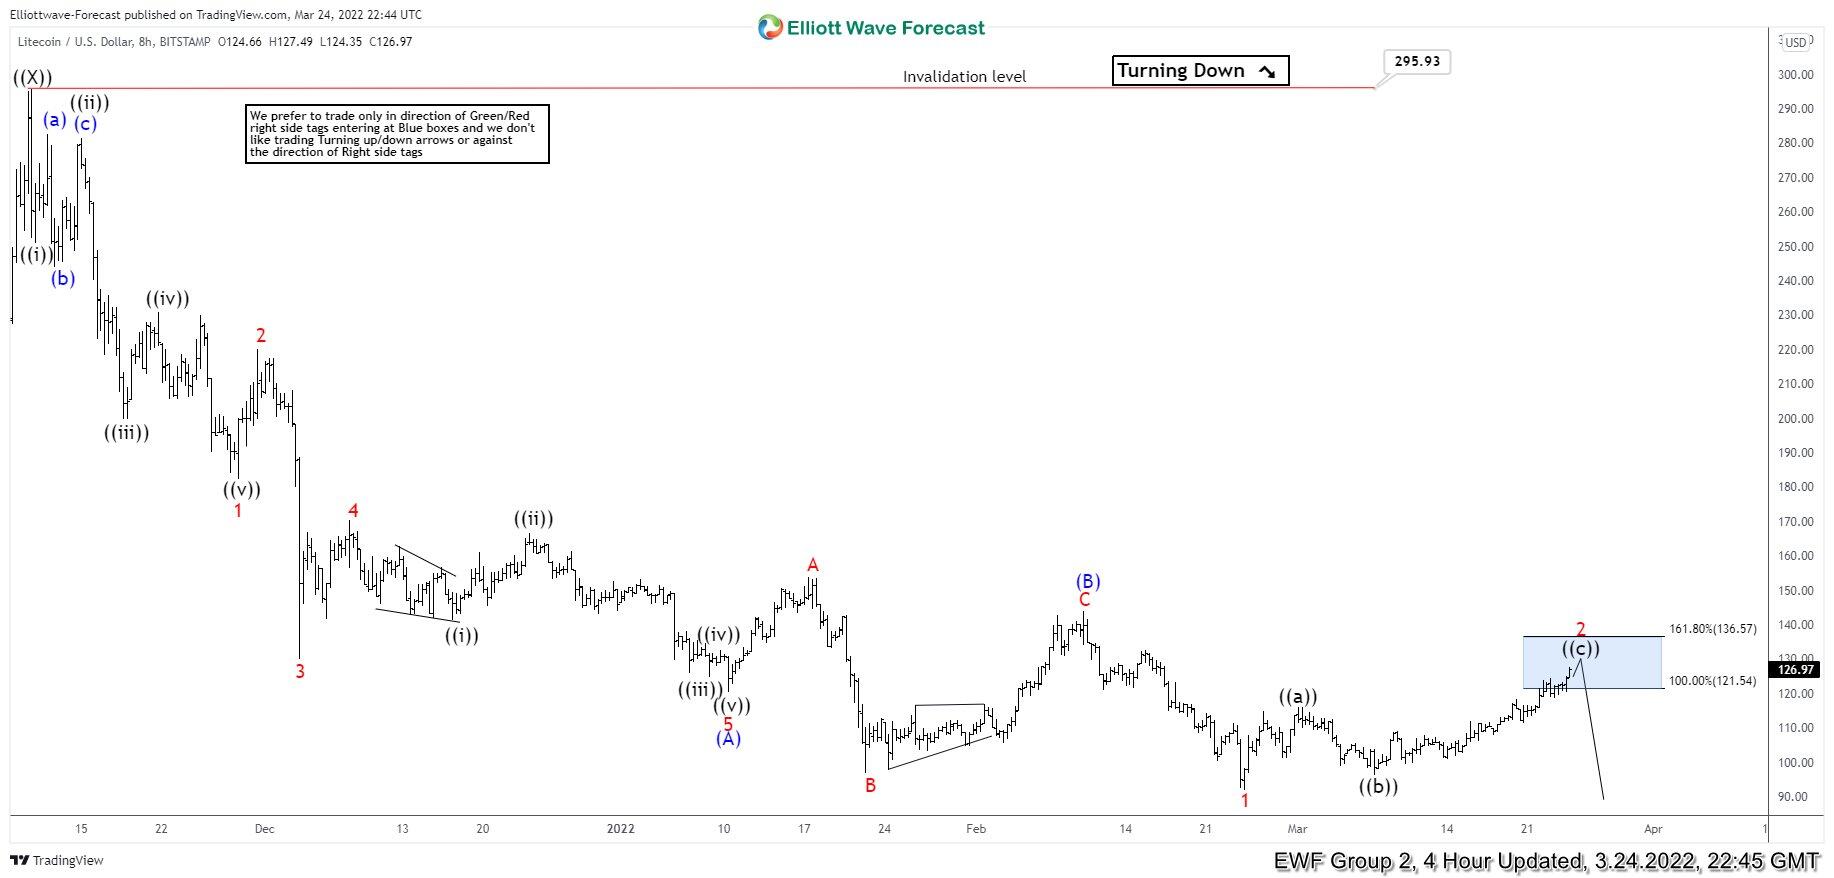
LTC/USD 4 hour Elliott Wave analysis: 24 March, 2022
Chart below shows decline from 11.10.2021 to be a 5 waves impulsive and it reached $120.49 reached on January 10, 2022. This was followed by a 3-3-5 running FLAT Elliott wave correction to complete at $144.13 on February 10, 2022. After this Litecoin resumed the decline and registered a new low at $91.74 on February 24, 2022.
LTCUSD started bouncing again and we highlighted $121.54 – $136.57 as 100 – 161.8% Fibonacci extension area with a blue box and as an area for 3 waves corrective bounce to complete. Our members knew a 3 waves advance should end in the mentioned and decline should resume while price stayed below 161.8% Fibonacci extension level at $136.57 or we should get 3 waves reaction lower at least.
Blue Boxes are High-Frequency areas which are based in a relationship of sequences, cycles and calculated using extensions. We refer to them as High Frequency trading areas, we prefer blue boxes to enter in direction of the trend because blue Boxes are areas where majority of the times, both buyers and sellers again in direction of next move for 3 swings at least and hence why they present high probability / low risk areas to enter the market in direction of the trend.
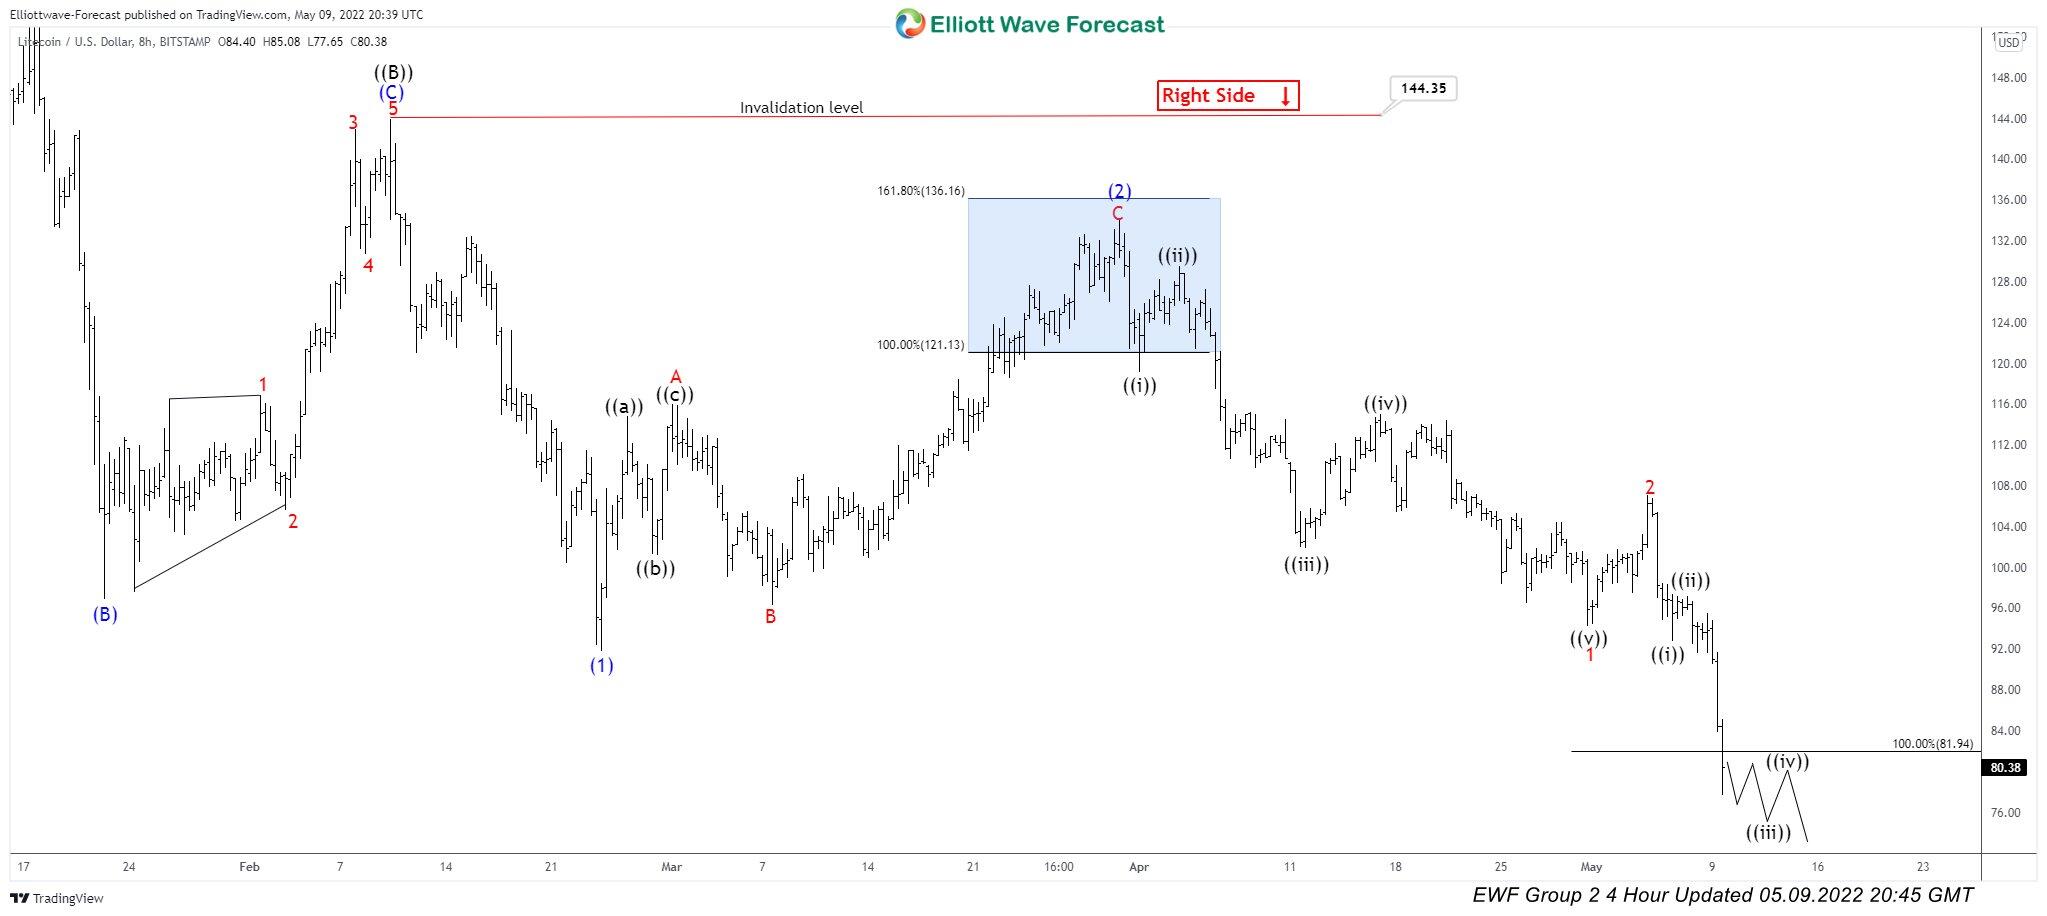
LTC/USD: 4 hour Elliott Wave analysis: 9 May, 2022
Chart below shows sellers did appear in the blue box area and LTCUSD resumed the decline, it dropped to a new low below February 24, 2022 low and today it reached 100% Fibonacci extension target at $81.94 which means it dropped $57 (42%) from the blue box high within 6 weeks providing a nice move for the clients. It already reached the minimum target at $81.94 but structure from blue box high is not a complete 5 waves move yet and we expect the bounces to fail for more downside to complete the structure.
Author

Elliott Wave Forecast Team
ElliottWave-Forecast.com


