Loopring price could fall below $1, but traders should give LRC more time to unfold
- Loopring price is up 80% since last week.
- LRC price has established an impulsive wave on the 12-hour chart.
- Invalidation of the bearish thesis will be a close above the current swing high at $1.36.

Loopring price has been nicknamed this month's "crypto rockstar" as the digital asset has outperformed almost every other cryptocurrency in the space. LRC saw an 80% spike as bulls left a clear impulse wave in their tracks. Now that the token is displaying a clear impulse wave on the 12-hour chart, analysts cautiously review the digital asset to gauge its next move.
Loopring price has magnets resting 23% below the current price
Loopring price 80% bull rally that occurred last week was impressive. A swing low to swing high Fibonacci retracement tool surrounding the 80% rally suggests LRC price could fall up to 23% into a .618 and .5 levels at $1.04 and $0.96, respectively. A second Fibonacci projection tool around the LRC rally's first wave up also suggests a .618 Fibonacci level lies within the same $1 vicinity. This scenario is likely to have traders maximizing their profits.
LRC price also has some bearish confluence in the volume pattern on the 12- hour chart. Despite the recent rise in price this Monday, there seems to be an uptick in sellers' volume. Traders aware of this pattern are less likely to add to their position at these prices. The bears may use this pattern to justify shorting the digital asset.
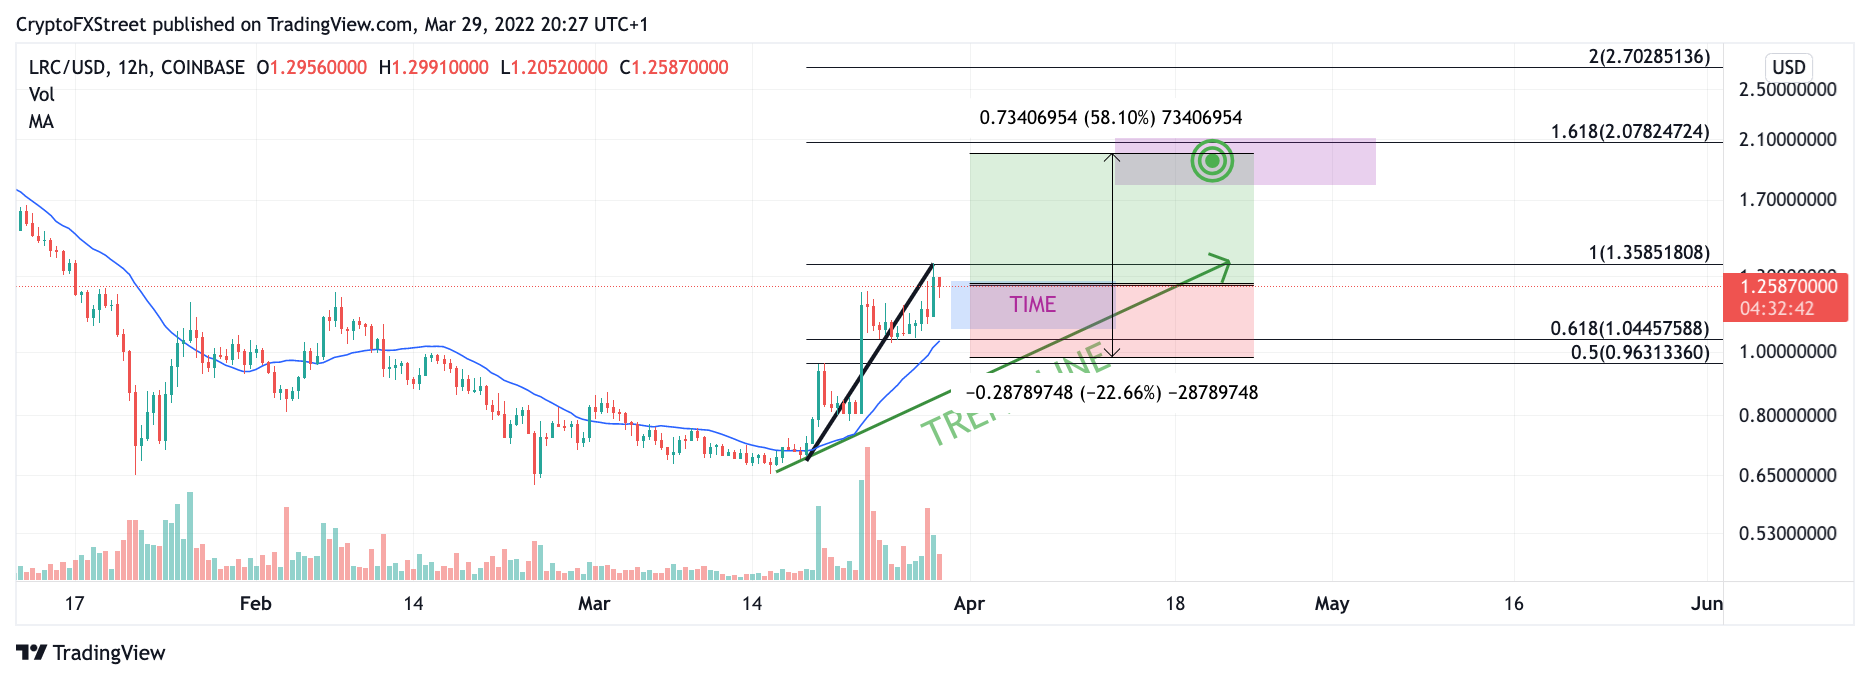
LRC/USD 12-Hour Chart
Loopring price does have the potential to continue rising, so the bearish thesis is not set in stone. The bears have established a higher close than the previous swing high on the 12-hour chart. This recent price action could be an early signal for more uptrend underway. A closing candle above the high at $1.36 could be the catalyst to propel the LRC price an additional 60% higher into the zone between $1.85 and $2, which lines up with the 1.618 Fibonacci level projected from the 80% rally.
LRC price bullish trend line does have a considerable amount of space away from the current price action, which could warrant traders to consider more time before deciding whether or not to open/close a position.
Author
FXStreet Team
FXStreet
Composed of a group of economic journalists and FX experts, the FXStreet content team produces and oversees all content published on FXStreet. It provides a purely journalistic approach to the Forex market.


