On-chain metrics show why loopring's LRC price is skyrocketing
Indicators help to comprehend the reason for crypto price rallies and if they can potentially last in time.
Recently GameStop (GME) announced it will build an NFT marketplace on top of the Ethereum layer 2, Loopring. These news have skyrocketed the price of Loopring’s tokens to grow more than 50% in a single day, and a total of 89% rise in just a week.
But what is Loopring? Loopring is an Ethereum layer two scaling solution based on zkRollup technology. These cryptographic attributes allow executing transactions off-chain in a verifiable manner. Its main advantage is that it allows large computational power without compromising the data. That is why it is presented as a scalability solution. Currently Loopring advertises a throughput of more than 2000 transactions per second, which allows them to offer several different products, that range from a wallet, to a decentralized exchange, and soon NFTs as well.
It is interesting to try to understand if this recent price move is just fueled by speculation or on the contrary there are signs of broader adoption. Analyzing the token activity requires inputs from several different kinds of sources. Here we will show on-chain data, exchanges data, and some social data. A deep analysis that uses this analysis has potentially higher confidence than just looking at the price performance, or how popular the token is currently in social media networks.
The first on-chain indicator we can look at is the addresses by time held indicator divides all the addresses with token balance into three groups: Hodlers: addresses that have held the asset over a period of one year. Cruisers: addresses with holding periods between one and twelve months. Traders: addresses that held the asset for less than one month. The number of addresses in each group is then shown over time to see the variations that each group has experienced. If we take the assumption that each address is close to one user, this indicator showcases the views of the market over each crypto asset.
In the chart below it can be seen that the line in blue representing those addresses that have been holding LRC for more than a year continues to grow surpassing the 69k addresses. At the same time, and quite contrary to what most crypto assets are doing nowadays, the green line that represents medium term holders continues to grow as well with 45k addresses. Additionally there does not seem to be much on-chain signs of speculation, since the yellow line showing short term traders seem to be decreasing steadily at 6k addresses. This could potentially signal that besides the news there are not many new investors willing to hold LRC:

Addresses by time held indicator as of March 23, according to IntotheBlock LRC analytics.
But let us take a look at what has been happening in centralized exchanges, since there is where most of the trading volume happens. The next indicator shows the historical traded volume of perpetual futures contracts over the last month. It can be seen how the volume ramped up dramatically since the news announcement. More than $6.5B traded in a single day while the usual volumes tended to average at around $150M.
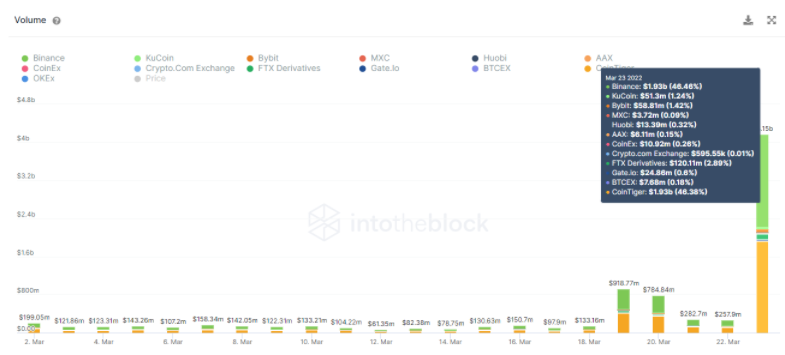
Volume traded of LRC in perpetual exchanges as of March 23, according to IntotheBlock LRC analytics.
This is a sign that points out that the LRC price increases seen these days could potentially be caused by short term traders that trade the news more than new investors willing to hold LRC, at least for the moment. In fact, the news had quite an impact, as can be seen in the next social indicator of search trends.
Search Trends are helpful to gauge global interest in a crypto-asset. Given the nature of searches, they tend to spike when there is a significant event or price movement for a particular crypto-asset. In the case of LRC, the news effect was notorious:
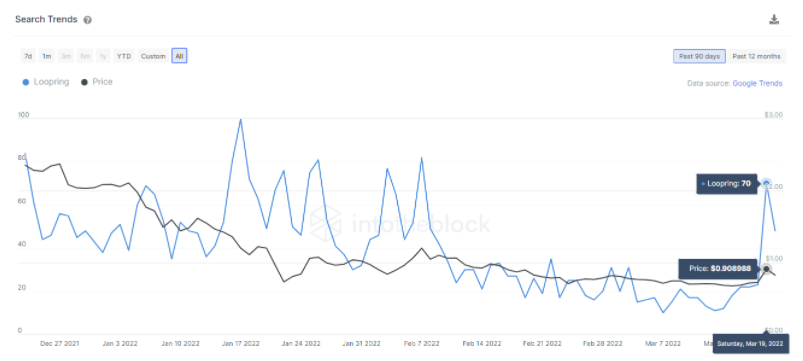
Search Trends as of March 23, according to IntotheBlock LRC analytics
It Is not anything negative or strange that positive news is initially very traded and attracts speculation. This short term action many times induces a feedback loop where the speculation makes the prices increase, which drives interest over the token (like what originated this article) and thanks to it new investors become aware of the asset and decide to buy and hold it with a medium to long term view instead of trading it. This catalyst of buys willing to hold for a longer term is what helps to sustain a higher price over time. As we have learnt in this article, on-chain metrics are a good indicator of this activity, while centralized exchanges metrics cater more to understand the short term activity over an asset. It will be interesting to keep an eye on these on-chain metrics to spot if the initial speculative activity results in higher investor adoption and then a potentially continued price rise over time.
Author

IntoTheBlock Team
IntoTheBlock
IntoTheBlock Team consists of a tribe of data scientists, crypto experts and AI geeks.


