Litecoin smashed against resistance as LTC collapses towards six-month lows
- Litecoin price made an attempt to terminate the current downtrend.
- Critical resistance prevented any further upwards momentum.
- Bears could drop Litecoin to $70.

Litecoin price continues to trend lower, threatening to create new six-month lows, perhaps even surpassing the 2021 lows.
Litecoin price positioned for a 40% move lower, extending the bearish oulook
Litecoin price action may soon entice a large number of sellers still on the sidelines to finally commit to some short positions. Buyers attempted to wrest control out of the bear's hands by simultaneously targeting a close above the daily Tenkan-Sen and Kijun-Sen. Success at doing so would trigger what could be the first leg of a new uptrend. However, bulls failed and LTC sold off.
If Litecoin price closed above the Tenkan-Sen and Kijun-Sen, the next Ichimoku resistance level doesn't show up until the bottom of the Cloud (Senkou Span A) at $165. So a move to $165 would be the first test of the Ichimoku Cloud since breaking out below it on December 5, 2021.
Buyers looked for a move to $165 that would probably push the Relative Strength Index to the 70 level. The Relative Strength Index is in bear market conditions, with the overbought levels at 55 and 65. LTC was just below the first overbought level of 55. If Litecoin price did move higher and moved the RSI to 70, then the Relative Strength Index would have likely converted into bull market conditions, with the overbought levels shifting to 80 and 90.
That Litecoin price was so close to completing the first truly bullish reversal in six months will continue to weigh on any future bullish participation.
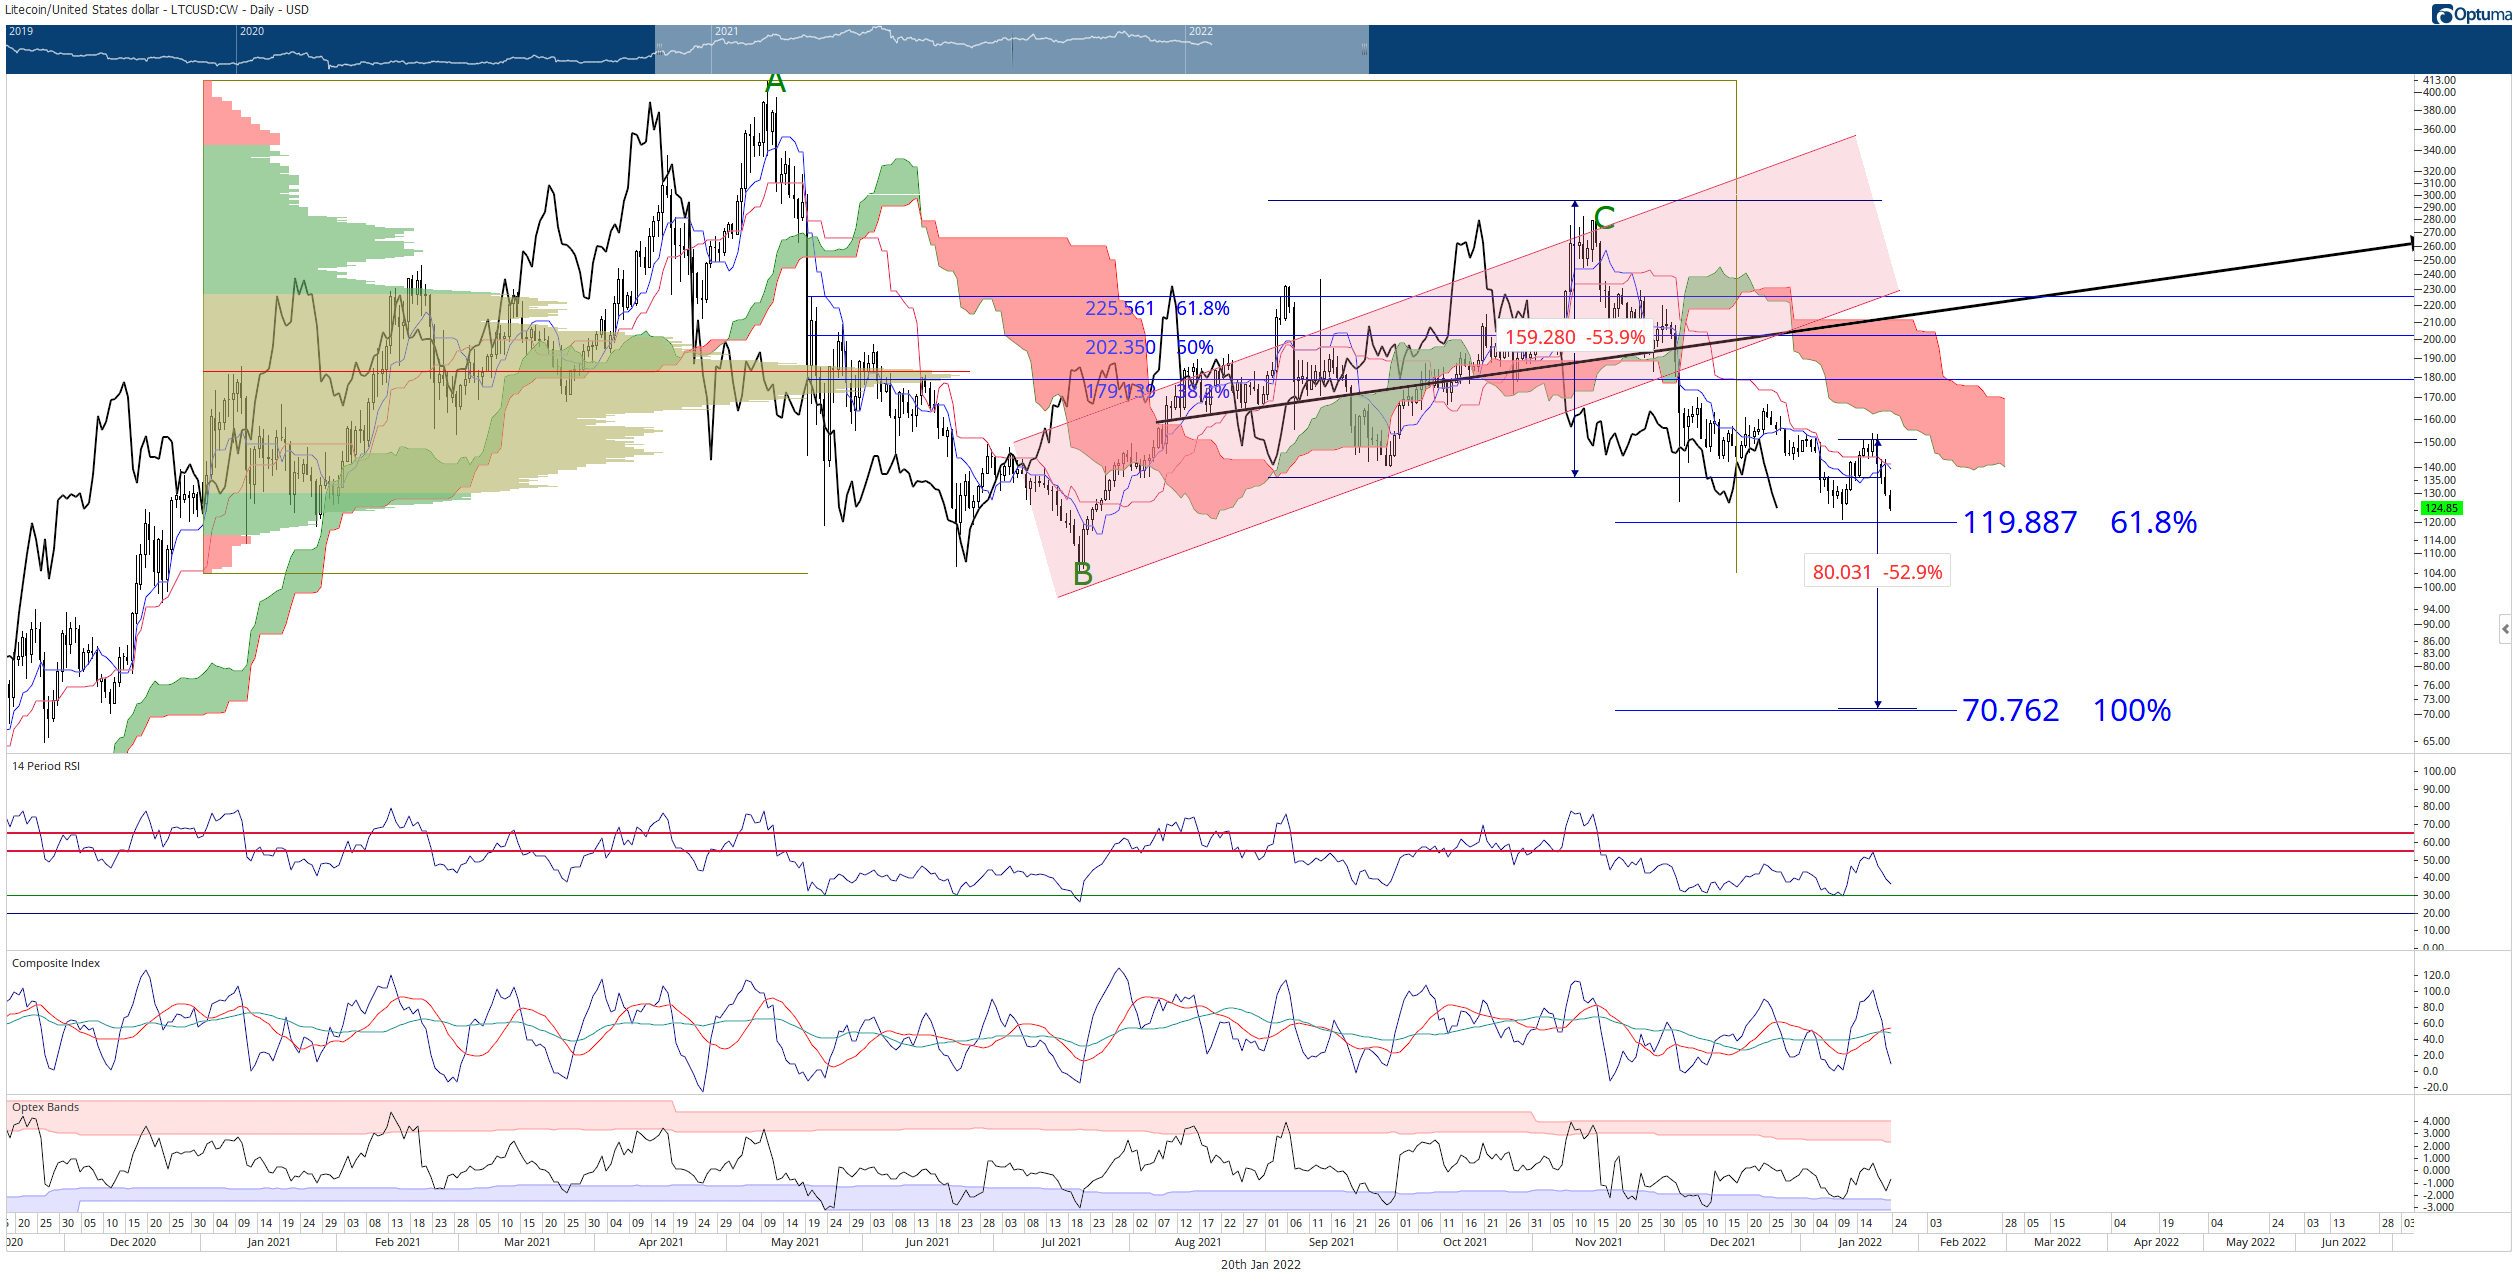
LTC/USD Daily Ichimoku Kinko Hyo Chart
Because Litecion price remains below the Ichimoku Cloud, the bias remains bearish, with sellers still in control. A close below the $120 level would invalidate any near-term bullish corrective outlook.
Litecon's support zones are nearly non-existent below $120, warning of capitulation move to the 100% Fibonacci retracement if support doesn't come in.
Author

Jonathan Morgan
Independent Analyst
Jonathan has been working as an Independent future, forex, and cryptocurrency trader and analyst for 8 years. He also has been writing for the past 5 years.