Litecoin price ready for a 40% rally but LTC bulls to face multiple hurdles
- Litecoin price shows a triple bottom setup on a 3-day chart, hinting at a 40% ascent.
- The 50-, 100-, and 200-day SMAs are plaguing LTC’s path at $157.03, $170.13 and $181.98, respectively.
- A decisive candlestick close below $103.82 will create a lower low, invalidating the bullish thesis.

Litecoin price shows a massively bullish pattern developing on a higher time frame, suggesting that a bull rally is on its way. Regardless of the optimistic setup, LTC’s path is sprinkled with multiple hurdles that could hurt and even stop the uptrend dead in its tracks.
Litecoin price eyes a higher high
Litecoin price has dropped roughly 54% over the last two months and is currently trading at $138.47. From January 25, 2021, to January 7, 2022, LTC has tagged the $129.62 support level three distinctive times, giving rise to the triple bottom setup.
This technical formation is a bullish reversal pattern and forecasts a trend shift from bearish to bullish. Therefore, market participants can expect LTC to make a run for the 3-day supply zone, ranging from $181.65 to $209.78.
Particularly, Litecoin price could dig into this resistance area and retest the $195.79 barrier, representing a 40% ascent from the current position.
However, the uptrend is not a cakewalk due to the presence of the 50-, 100- and 200-day Simple Moving Averages (SMAs) at $157.03, $170.13 and $181.98, respectively.
Market participants should note that the bull rally detailed above could slow down or stop due to the immense selling pressure at the aforementioned levels.
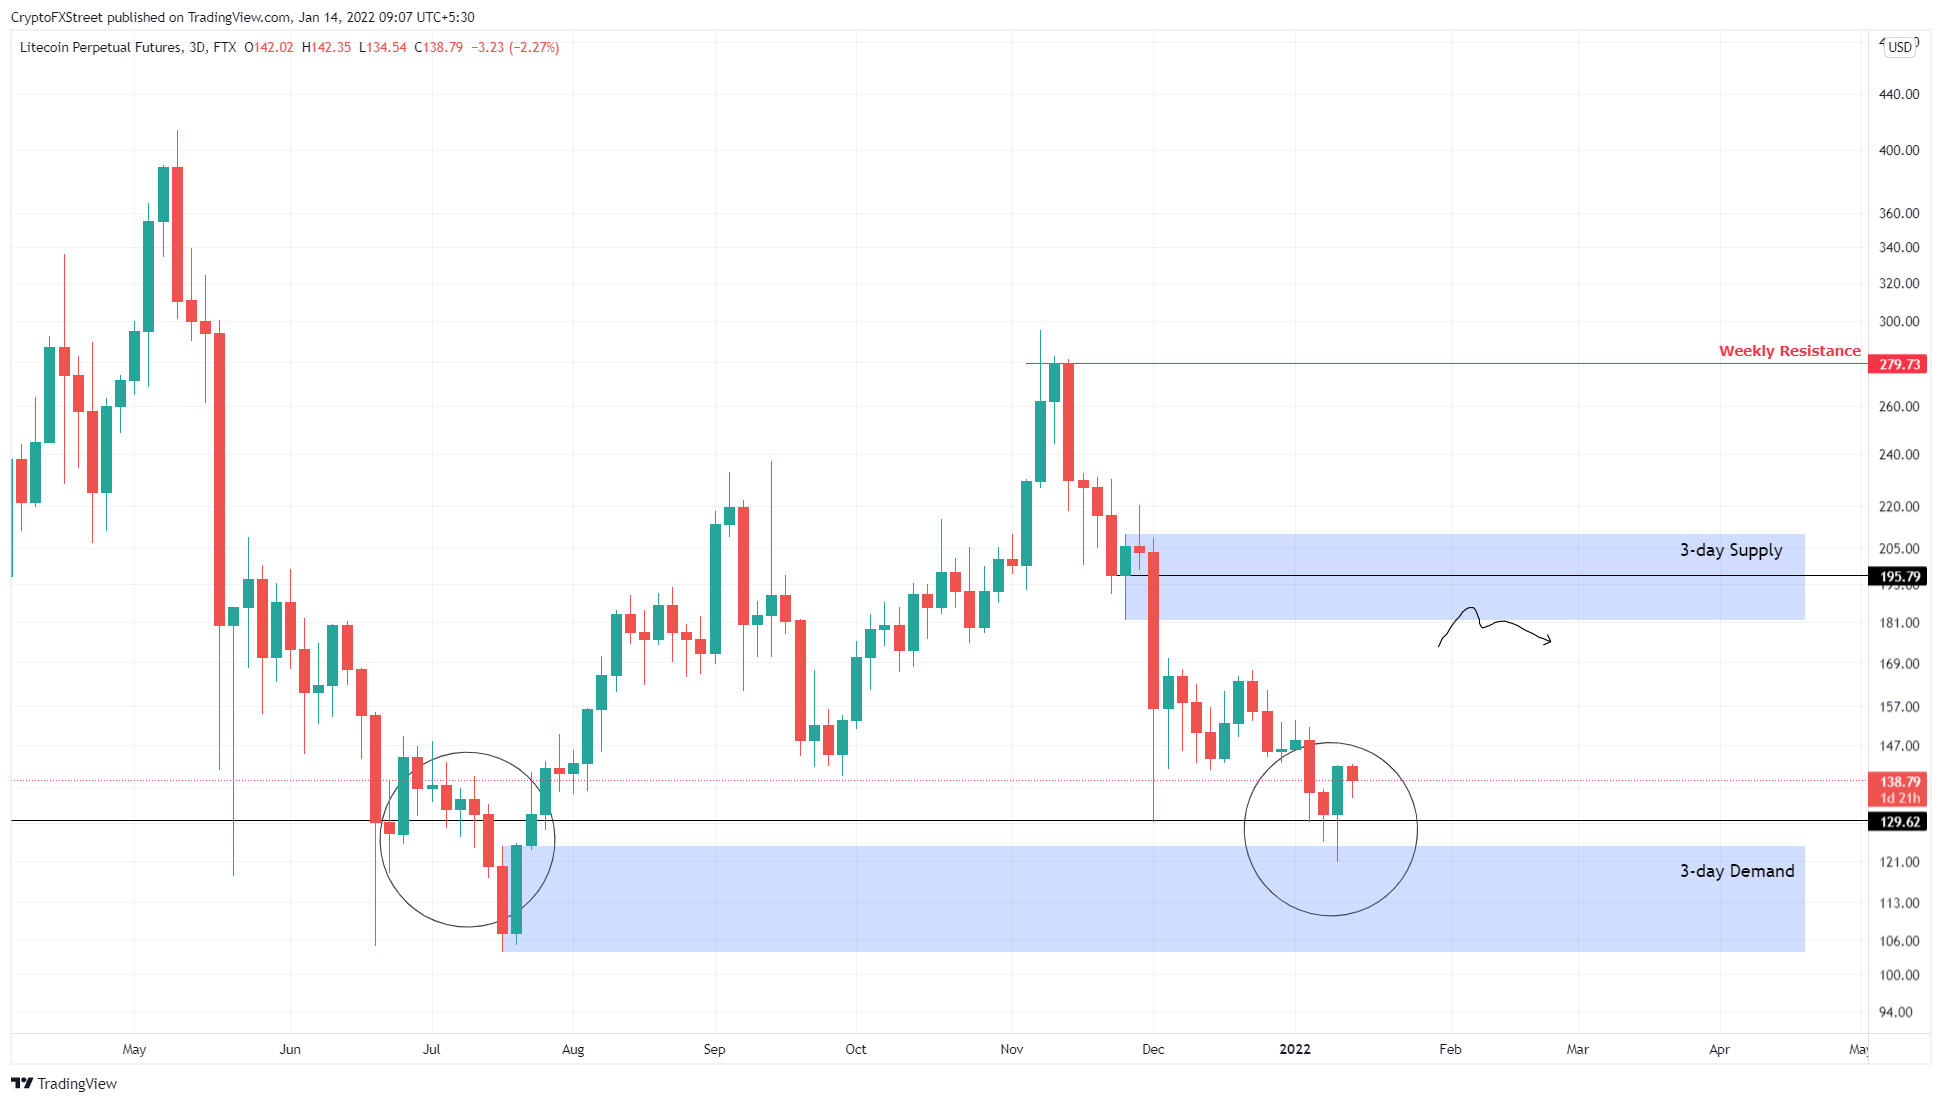
LTC/USDT 3-day chart
Supporting this arduous journey for Litecoin price is IntoTheBlock’s Global In/Out of the Money (GIOM) model. This on-chain index shows that nearly 938,000 addresses that purchased roughly 14.72 million LTC tokens at $152.43 and $169.10 are “Out of the Money.”
These holders could break even by offloading their holdings if LTC ever reaches these levels, thereby increasing the overall sell-side pressure. Interestingly, these price levels coincide with the 50- and 100-day SMAs, adding proof to the aforementioned theory.
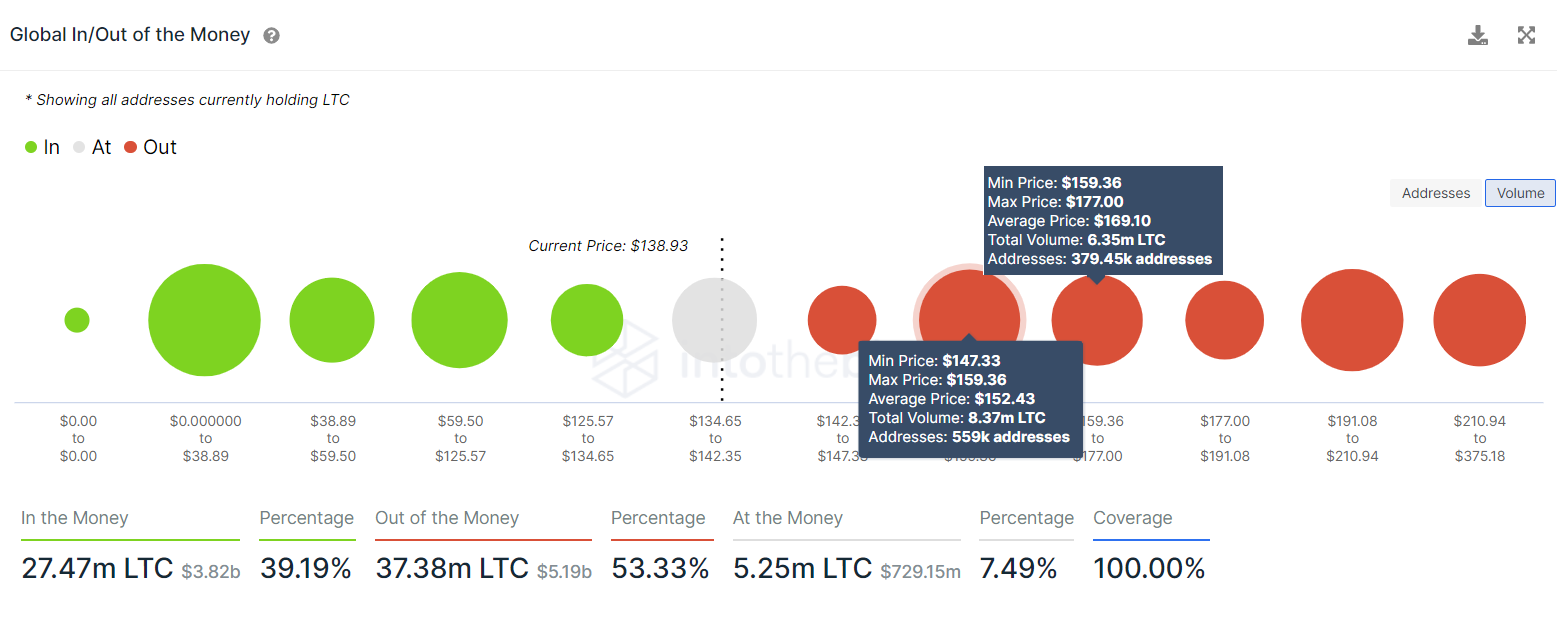
LTC GIOM
While the above on-chain indicator suggests that the rally for Litecoin price may be truncated, the 24-hour active addresses trend shows that user interest is high. Since December 26, 2021, the number of active addresses has increased from 247,000 to 354,000.
This 43% increase in active users suggests that market participants are interested in LTC at the current price levels, adding weight to the bullish outlook.
 [09.29.37, 14 Jan, 2022]-637777340341670581.png)
LTC active addresses
While Litecoin price may not rally to $195.79 in a swift manner, there is a good chance it will retest the 50-day SMA at $157.03 and make an effort to retest the 200-day SMA at $170.13. So, investors can expect a 21% upswing and a 30% run-up, respectively, and even to the supply zone’s lower limit at $181.65.
However, if Litecoin price produces a three-day candlestick close below $103.82, it will create a lower low, invalidating the triple bottom bullish thesis.
Author

Akash Girimath
FXStreet
Akash Girimath is a Mechanical Engineer interested in the chaos of the financial markets. Trying to make sense of this convoluted yet fascinating space, he switched his engineering job to become a crypto reporter and analyst.


