Litecoin price still distracted, but there may be light at the end of the tunnel for LTC
- Litecoin price downside momentum slows, forming a falling wedge pattern.
- LTC is currently down -8% for the week and is trading below the strategically important 50-week simple moving average (SMA).
- 78.6% Fibonacci retracement of the 2020-2021 advance is recognizable support if selling persists.

Litecoin price has failed to hold the support granted by the 50-week SMA, creating another touch on the upper resistance line of the falling wedge. The failure to stick at the crucial moving average does direct LTC expectations toward lower prices. Still, the waning momentum to the downside, highlighted by the falling wedge, promotes the view that the downside should be limited to the June low.
Litecoin price still standing on the wrong foot
Litecoin price corrected 75% from the May high of $413.91 to the June low of $105.00 after reaching an extreme deviation from the 50-week SMA of 240%, marking the biggest LTC deviation from the moving average since the beginning of 2018 and an extremely overbought condition.
Since the May collapse, Litecoin price has incrementally shaped a falling wedge pattern with support materializing between the June 2019 high of $146.00 and the 50-week SMA at $138.64. This week LTC has unlocked from the moving average, potentially with the intent to test the 78.6% Fibonacci retracement of the 2020-2021 advance at $108.23 or a sweep of the June low of $105.00. A test of the June low would represent a minor loss of 15% from the current price.
A failure to strike support in the range of $105-$108 leaves Litecoin price unprotected, projecting a test of the intersection of the wedge’s lower support line with the 200-week SMA (mean) at $96.28, producing a 22% decline from the current price. Any weakness beyond the mean would be a surprise unless the current distractions of a weak cryptocurrency complex become more intense.
However, if Litecoin price is not close to completing the correction, the potential losses could be massive based on the position of LTC to the 50-week SMA. Currently, the altcoin is -11% below the moving average, which is nowhere near the deviations printed at important lows in previous bear market markets.
For example, at the March 2020 low, Litecoin price was -51% below the moving average. At the December 2019 low, the deviation was -40%. And, at the December 2018 low, the deviation reached -76%. Therefore, LTC investors should not assume that everything ends at the 200-week SMA, particularly when the trend still has the cryptocurrency standing on the wrong foot.
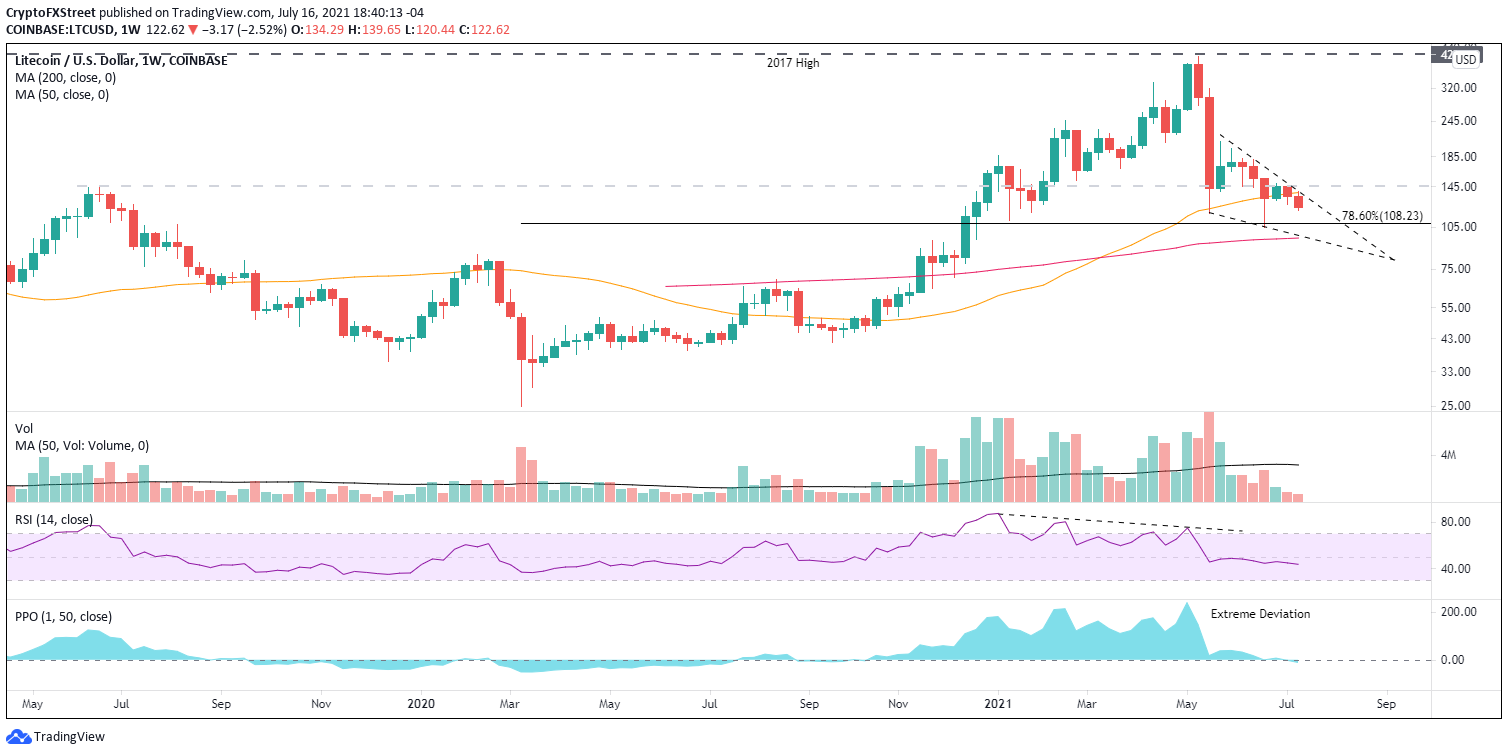
LTC/USD weekly chart
To nullify the bearish narrative, Litecoin price needs a weekly close above the June 2019 high of $146.00. If successful, LTC can charge towards the 200-day SMA at $192.93.
The falling wedge does highlight the decrease in downside momentum, and the Litecoin price pattern portends a bullish reversal moving forward. Still, it is not guaranteed, and the timing is not apparent. Nevertheless, despite the distractions of the weak cryptocurrency market, the presence of a bullish pattern with clear price levels hints there is light at the end of the tunnel for LTC.
Author

Sheldon McIntyre, CMT
Independent Analyst
Sheldon has 24 years of investment experience holding various positions in companies based in the United States and Chile. His core competencies include BRIC and G-10 equity markets, swing and position trading and technical analysis.


