Litecoin Price Forecast: LTC offers a compelling opportunity above $146
- Litecoin price falls to within $10 of the 200-week SMA (the mean).
- Weekly Ichimoku cloud emerges to halt the drop below the May low.
- IOMAP metric shows credible support between $117.91 and $126.14.

Litecoin price is trying to recover support at the 50-week simple moving average (SMA) as LTC now trades in the upper half of the weekly range. The rebound has channeled minimal interest as daily volume has shrunk every day. Nevertheless, a permanent low may have been established on June 22, supported by the reversion to the 200-week SMA, which now only requires more commitment from speculators.
Litecoin price has tremendous upside potential, but still far from realizing it
At the June 22 low, Litecoin price had plunged 75% in just over a month and severed the support attached to the May 23 low before identifying support at the weekly Ichimoku cloud. The low came in just above the 200-week SMA (the mean). The event serves as a warning to bearish LTC investors seeking to punish the digital token further.
Despite the developments this week, Litecoin price is confronted by several technical obstacles, including the resistance of the 50-week SMA at $133.58. LTC is trading slightly above the moving average, but it is all about the close at the end of the week, not today. A second obstacle to erasing the weekly loss is the dominance of the June 2019 high of $146.00. In May, Litecoin price closed just below the June 19 high, and the level supported the first two weeks of June.
Another obstacle that impedes a successful break above the June 2019 high is LTC investor commitment, as proved by the weak volume. Without it, the rebound takes the look of a dead-cat bounce, and probabilities rise that Litecoin price begins trending lower again before the end of the week.
One final obstacle is the pending Death Cross as the 50-day SMA is inching closer to crossing below the 200-day SMA. The cross does not guarantee a new leg lower for LTC, but it will for sure offer more resistance if the rebound gains traction.
A weekly close above the 50-week SMA and a daily close above the June 19 high is the perfect recipe for a new Litecoin price advance. If it comes to fruition, the only obstacle of note on the weekly chart, before the Fibonacci levels, is the anchored VWAP from the November 2020 breakout above the 200-week SMA at $182.06. The anchored VWAP was exceptional resistance on a weekly closing basis the previous four weeks.
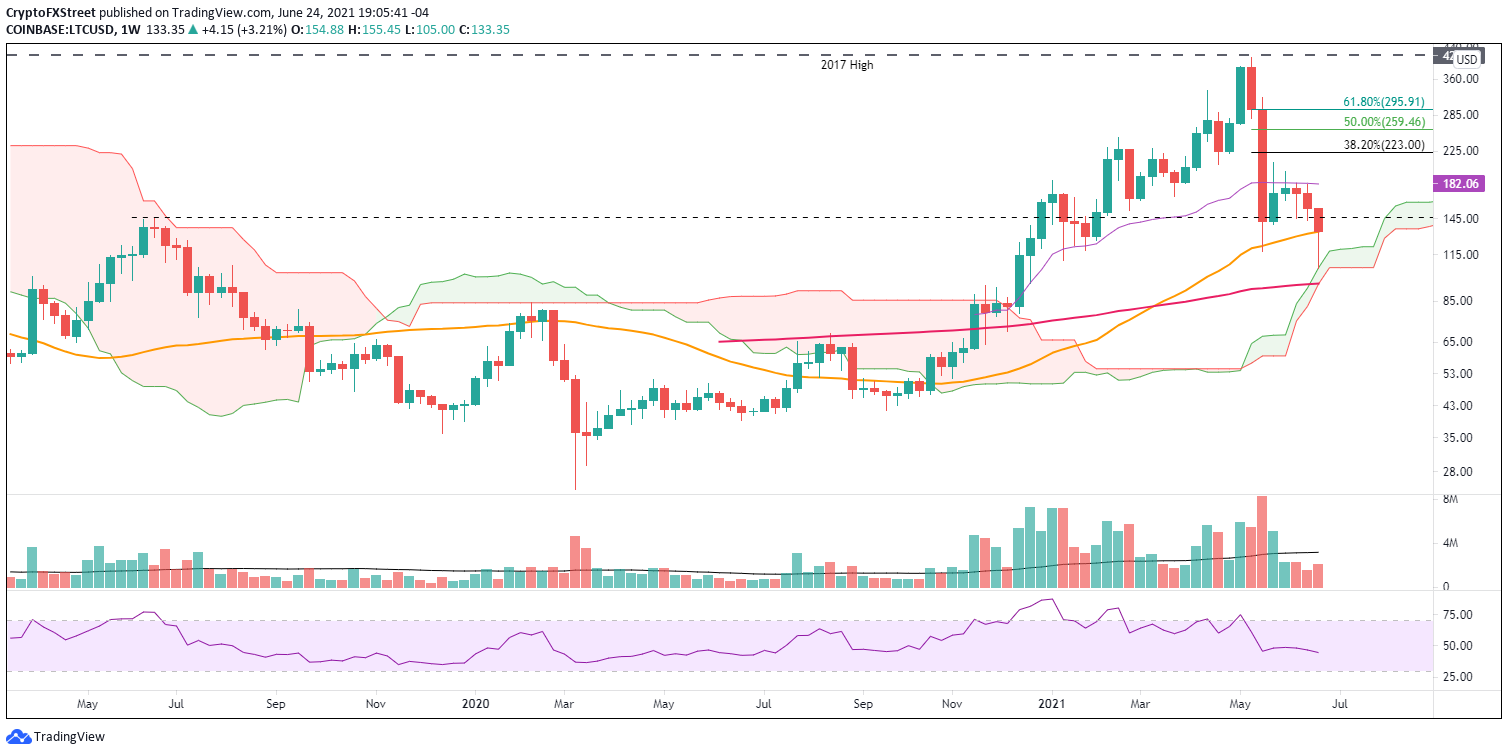
LTC/USD weekly chart
If Litecoin price closes Sunday below the 50-week SMA, it will hint that Litecoin price will, at best, shuffle sideways, and at worst, pursue another test of the May low of $117.58. A drop to this week’s low of $105 remains a low probability event based on the charts’ price structure.
The latest IntoTheBlock In/Out of the Money Around Price (IOMAP) price clusters show meaningful support between $117.91 and $126.14, with a total of 123k addresses owning 2.86 million LTC. The price range corresponds loosely with the May low, suggesting that $117.58 will be a challenge to defeat.
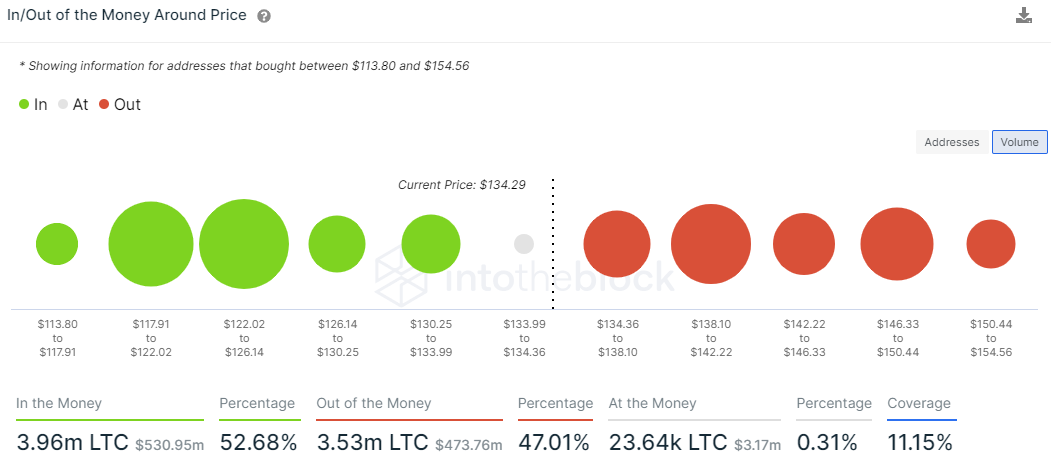
LTC IOMAP - IntoTheBlock
However, there are pockets of resistance (out of the money addresses) at $138.10-$142.22 and $146.33-$150.44. Combined, they confirm the June 2019 high of $146.00 as a definite obstacle to a sustainable advance.
Supporting a potential bottom for Litecoin price is the Santiment 365-day MVRV (Market Value to Realized Value) ratio as it came close to the December 2019 and March 2020 lows. Litecoin price exploded after the December 2019 and March 2020 lows. The metric measures the average profit/loss of LTC investors that purchased the altcoin over the last year.
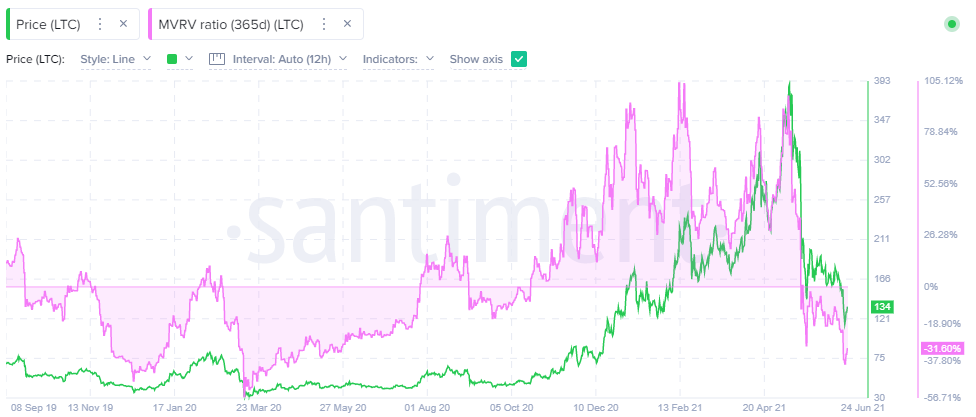
LTC MVRV - Santiment
Therefore, Litecoin price does face some immediate challenges, as expressed by the charts and the LTC IOMAP price clusters. Still, the MVRV ratio dictates that any further weakness should be bought, and the longer-term outlook is compelling.
Author

Sheldon McIntyre, CMT
Independent Analyst
Sheldon has 24 years of investment experience holding various positions in companies based in the United States and Chile. His core competencies include BRIC and G-10 equity markets, swing and position trading and technical analysis.


