Litecoin Price: Previously dormant coins on the move as LTC triggers a 20% breakout
- Litecoin price (LTC) flips bullish ahead of a 20% rising triangle breakout.
- Santiment’s Age Consumed metric spikes to show that previously idle coins are on the move.
- LTC awaits a volatility burst that might help it achieve a seemingly imminent rally to $75.53.
- Litecoin price will invalidate the optimistic outlook if it closes the day below the triangle resistance at $75.53.

Litecoin price is among the few cryptocurrencies likely to end the week on a positive note. A higher low pattern, printed over the last seven days, paints a bullish picture for LTC. Meanwhile, Litecoin price holds at $63.22 while patiently waiting for an incoming volatility burst to close the gap to $75.53.
Previously dormant coins triggered by increased exchange outflows
The implosion of FTX left no stone unturned in the crypto market. A liquidity crunch crisis experienced after Alameda Research, FTX’s sister company, filed for bankruptcy saw Coinbase analysts foreshadow a lengthy crypto winter as far as the end of 2023.
Centralized exchanges also experienced the largest ever weekly Bitcoin (BTC) outflows. According to a report by CryptoCompare, 97,805 BTC moved off the exchanges in the seven days ending November 13.
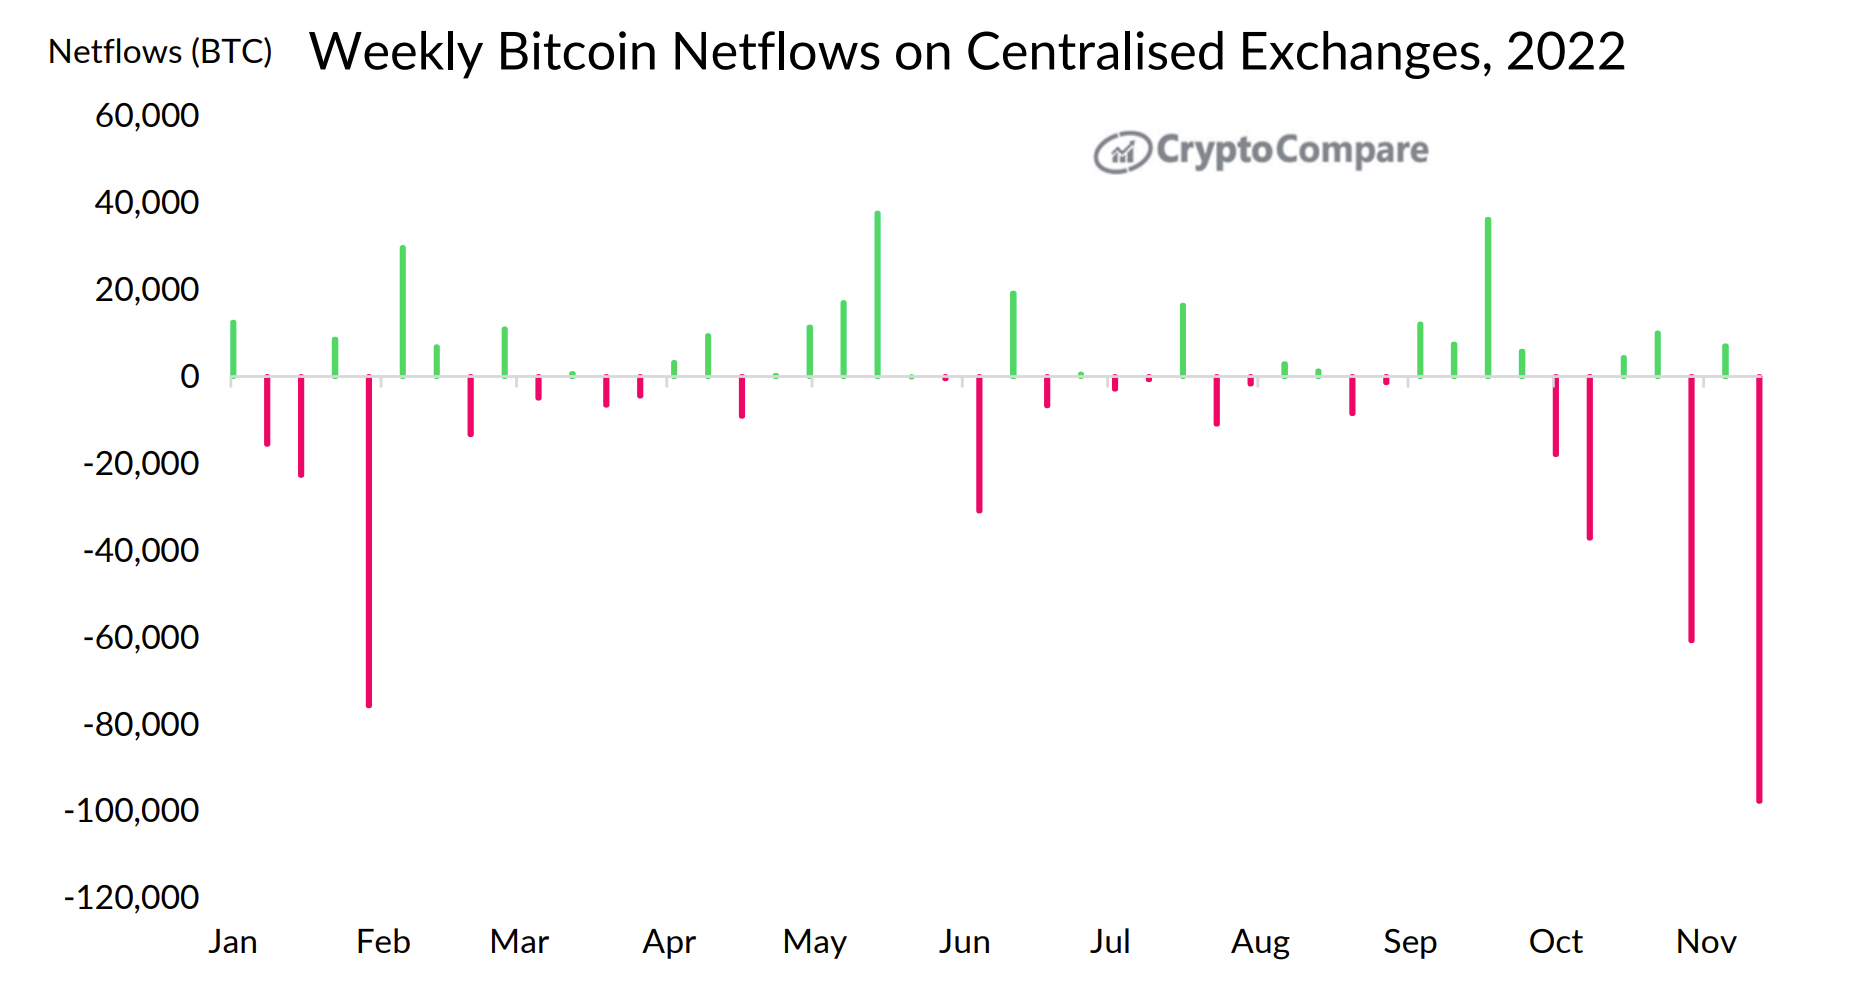
Weekly Bitcoin Netflows – Centralized Exchanges
Since the FTX crisis negatively impacted many investors across the market, Litecoin may have faced increased outflows from centralized exchanges. On-chain data by Santiment shines a light on previously dormant LTC coins that have been on the move this week.
According to the Age Consumed Metric shown below, 1.3B LTC tokens changed addresses on November 14. The movement of large sums of previously idle coins is usually a catalyst for volatility. Hence, the foreshadowed breakout to $75.00.
 [15.29.55, 18 Nov, 2022]-638043768366228643.png)
Litecoin Age Consumed metric
Litecoin price is on the verge of a 20% breakout
The 18th largest cryptocurrency trades at $63.12 moments after breaking the rising triangle resistance at $63.00. Printing a higher low pattern cemented the bulls’ grip on the price, creating optimum conditions for a northbound move. A 20% move above the breakout point to $75.00 equals the distance between the widest points of the triangle.
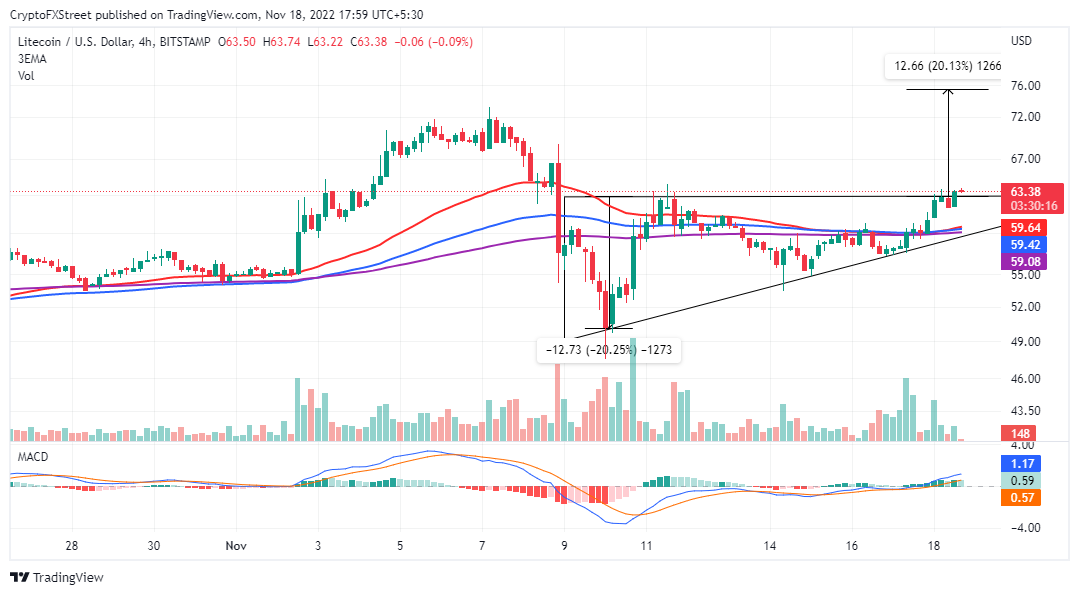
LTCUSD four-hour chart
The Moving Average Convergence Divergence (MACD) indicator’s position at 1.16 – above the mean line places Litecoin price in the bulls’ hands. The gap formed by the 12-day Exponential Moving Average (EMA) (in blue) above the 26-day EMA (in brown) shows that the path with the least resistance is to the upside.
IntoTheBlock’s IOMAP model reinforces the bulls’ strong position in the market due to the buyer congestion zone between $57.33 and $59.20. Approximately 289,000 addresses previously purchased 8.74 million LTC in that range. Attempts by bears to push for lower price levels below this zone, therefore, are unlikely to see the light of day since LTC holders will likely work tirelessly to protect their positions and the bullish outlook in Litecoin price.
-638043769237756753.png)
Litecoin IOMAP model
Although Litecoin price eyes a 20% move above the triangle pattern to $75.00, traders must be cautious and keep in mind the FTX implosion and its negative effects on the market.
Failure to close the day above the triangle resistance at $63.00 could flip LTC’s outlook from bullish to bearish, with downside profit targets at the 200-day EMA (in blue) and lower support areas – at $55.00 and $50.00, respectively.
Author

John Isige
FXStreet
John Isige is a seasoned cryptocurrency journalist and markets analyst committed to delivering high-quality, actionable insights tailored to traders, investors, and crypto enthusiasts. He enjoys deep dives into emerging Web3 tren


