- Litecoin price hovers within a descending parallel channel.
- The 200-week moving average is currently 65% above the current market value.
- Key levels have been identified for both a bearish and bullish scenario.
Litecoin price is inching towards a breakout, but jumping in too soon could result in a whirlwind of pain.
Litecoin price bullish scenario
Litecoin price currently trades at $58.78 as the bulls and bears collide on smaller time frames. Although the Litecoin price has witnessed significant suppression from the bears throughout the summer, a reversal can always occur.
Litecoin price has breached both the 8- and 21-day simple moving averages, which confounds the idea that bulls are ready to retaliate. Additionally, there is an uptick in volume amidst the recent breach.
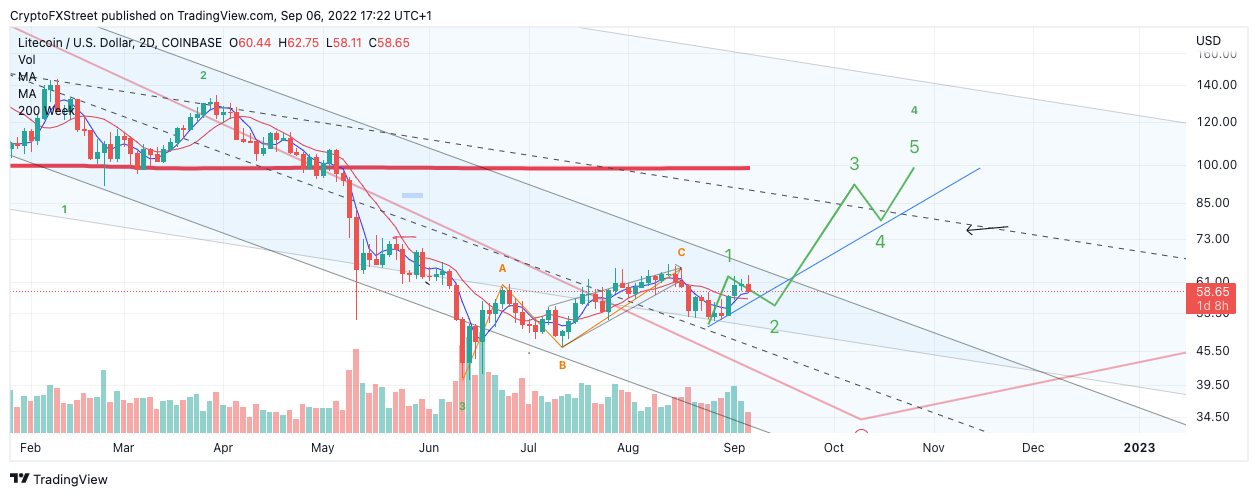
LTC USD 4-Hour Chart Bullish Scenario
If the bulls can produce a closing candle above $75, a rally towards $90 at the 200-week moving average will be in the cards. Such a move would result in a 65% increase from the current market value.
Litecoin price bearish scenario
Litecoin price still has significant boundaries to cross before confidence starts pouring into the market. Litecoin price has not provided a clear five-wave impulse since the June 18 crypto selloff. Additionally, the largest 2-day candle dating back to December 3, 2021, remains unchallenged in size.
Litecoin price will need to stabilize above the 8- and 21-day-SMA's without waking up sleeping bears. Any close below the indicators could provoke a bearish cross and prompt institutional traders to join in for a quick profit.
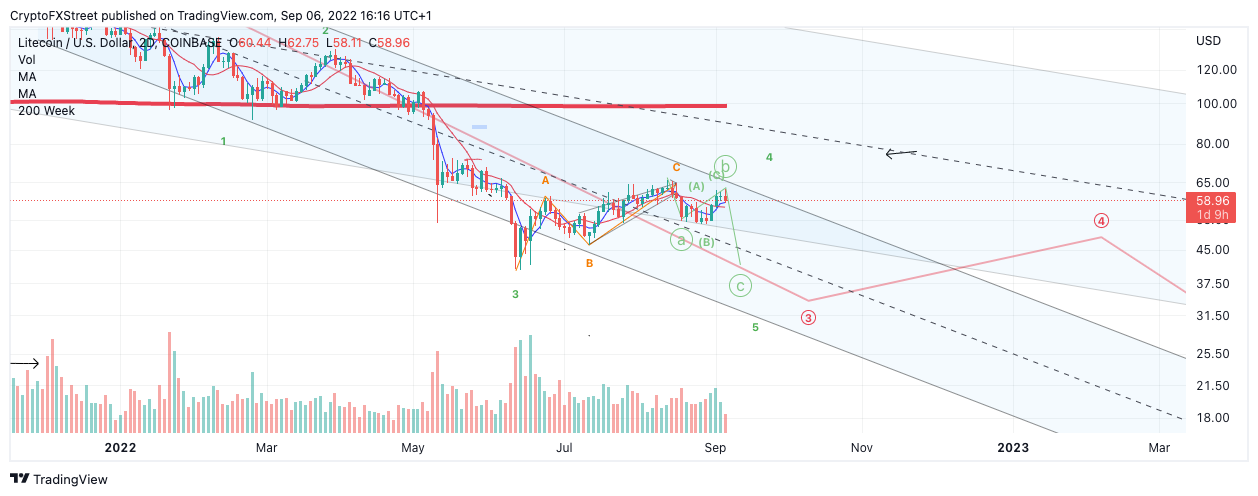
LTC USD 2-Hour Chart Bearish Scenario
A closing candle below $56 on the 2-day chart could catalyze a plummet into the $30 price zone, resulting in a 48% decrease from the current Litecoin price.
In the following video, our analysts deep dive into the price action of Litecoin, analyzing key levels of interest in the market. -FXStreet Team
Information on these pages contains forward-looking statements that involve risks and uncertainties. Markets and instruments profiled on this page are for informational purposes only and should not in any way come across as a recommendation to buy or sell in these assets. You should do your own thorough research before making any investment decisions. FXStreet does not in any way guarantee that this information is free from mistakes, errors, or material misstatements. It also does not guarantee that this information is of a timely nature. Investing in Open Markets involves a great deal of risk, including the loss of all or a portion of your investment, as well as emotional distress. All risks, losses and costs associated with investing, including total loss of principal, are your responsibility. The views and opinions expressed in this article are those of the authors and do not necessarily reflect the official policy or position of FXStreet nor its advertisers. The author will not be held responsible for information that is found at the end of links posted on this page.
If not otherwise explicitly mentioned in the body of the article, at the time of writing, the author has no position in any stock mentioned in this article and no business relationship with any company mentioned. The author has not received compensation for writing this article, other than from FXStreet.
FXStreet and the author do not provide personalized recommendations. The author makes no representations as to the accuracy, completeness, or suitability of this information. FXStreet and the author will not be liable for any errors, omissions or any losses, injuries or damages arising from this information and its display or use. Errors and omissions excepted.
The author and FXStreet are not registered investment advisors and nothing in this article is intended to be investment advice.
Recommended Content
Editors’ Picks
Space ID price succumbs to selling pressure with $3.54 million worth of ID tokens unlocked in a cliff event

Space ID (ID) price remains bullish based on the Parabolic SAR price-tracking indicator, which continues to track ID price from below. However, the token is trading at a value that is significantly lower than its rate 24 hours ago, an outcome attributed to its scheduled token unlocks event.
Quant price maintains steady multi-month downtrend but 60% of QNT holders remain above water

Quant (QNT) price is trading with a bearish bias, a steady state that has prevailed for the most part of the year. Despite the downtrend, the majority of QNT token holders remain above water, sitting on unrealized profit.
Optimism receives backlash after decision to split 116 million OP tokens for treasury management

Optimism network recently announced the sale of 116 million OP tokens valued at around $162.4 million in a private sale to seven purchasers for treasury management. While the transaction was not expected to impact OP price, it has provoked backlash from onlookers.
Binance unintentionally causes Ethereum gas fees to soar 1,900% as hundreds of inactive wallets move ETH

With many transfers happening within a thin timeframe, Ethereum gas fees soared 1,900%, moving from 15 to around 300 Gwei. The same was reflected in simple Peer-to-Peer (P2P) transactions, which soared from the conventional 40 cents to around $10, data from Dune analytics shows.
Bitcoin: BTC contemplates crash in September

Bitcoin price remains unfazed by the US CPI announcement on September 13 and continues to move in a range. The weekly chart, however, shows a potential short-term recovery rally that could set the stage for a steep correction.