• Litecoin price slipped yesterday after a perfect series of gains since February 3.
  • The dip looks short-lived as bulls are trembling before the monthly R1 and red descending trend line, poised for a breakout.
  • Expect a tiered rally with profit-taking at $160, $170 and $180 before thinking about $200.

Litecoin (LTC) price underwent a short correction yesterday after bulls faced a double hurdle with the intersection of the red descending trendline with the monthly R1 resistance level. Buyers got pushed out of the breakout zone but have made a comeback today with some global market tailwinds in their corner, and they are trying to break the downtrend since November. A breakthrough would see solid gains with some profit-taking around $160, $170 and $180, before targeting $200 in the medium term.

Bull run ready to start with ultimate gains of almost 48%

Litecoin price underwent a short correction as bulls were unfit to break above the double whammy of resistance at $144. After the rejection, price slipped below the 55-day Simple Moving Average, around $134. But bulls saw a solid opening this morning with a clear bounce off that 55-day SMA and are set to break $134 with some additional tailwinds coming from global markets.

LTC price action welcomes these new tailwinds as investors look beyond central banking and start to look for more investment opportunities, including cryptocurrencies. The additional interest, buy volume, and tailwinds set Litecoin up for a breakout trade with the monthly R1 resistance level as the critical level to close above this week. From there, the following level to sight is $160, as the cap of the distribution zone. Following that is $170 and the 200-day SMA, and after that $180, situated near the monthly R2 resistance level.
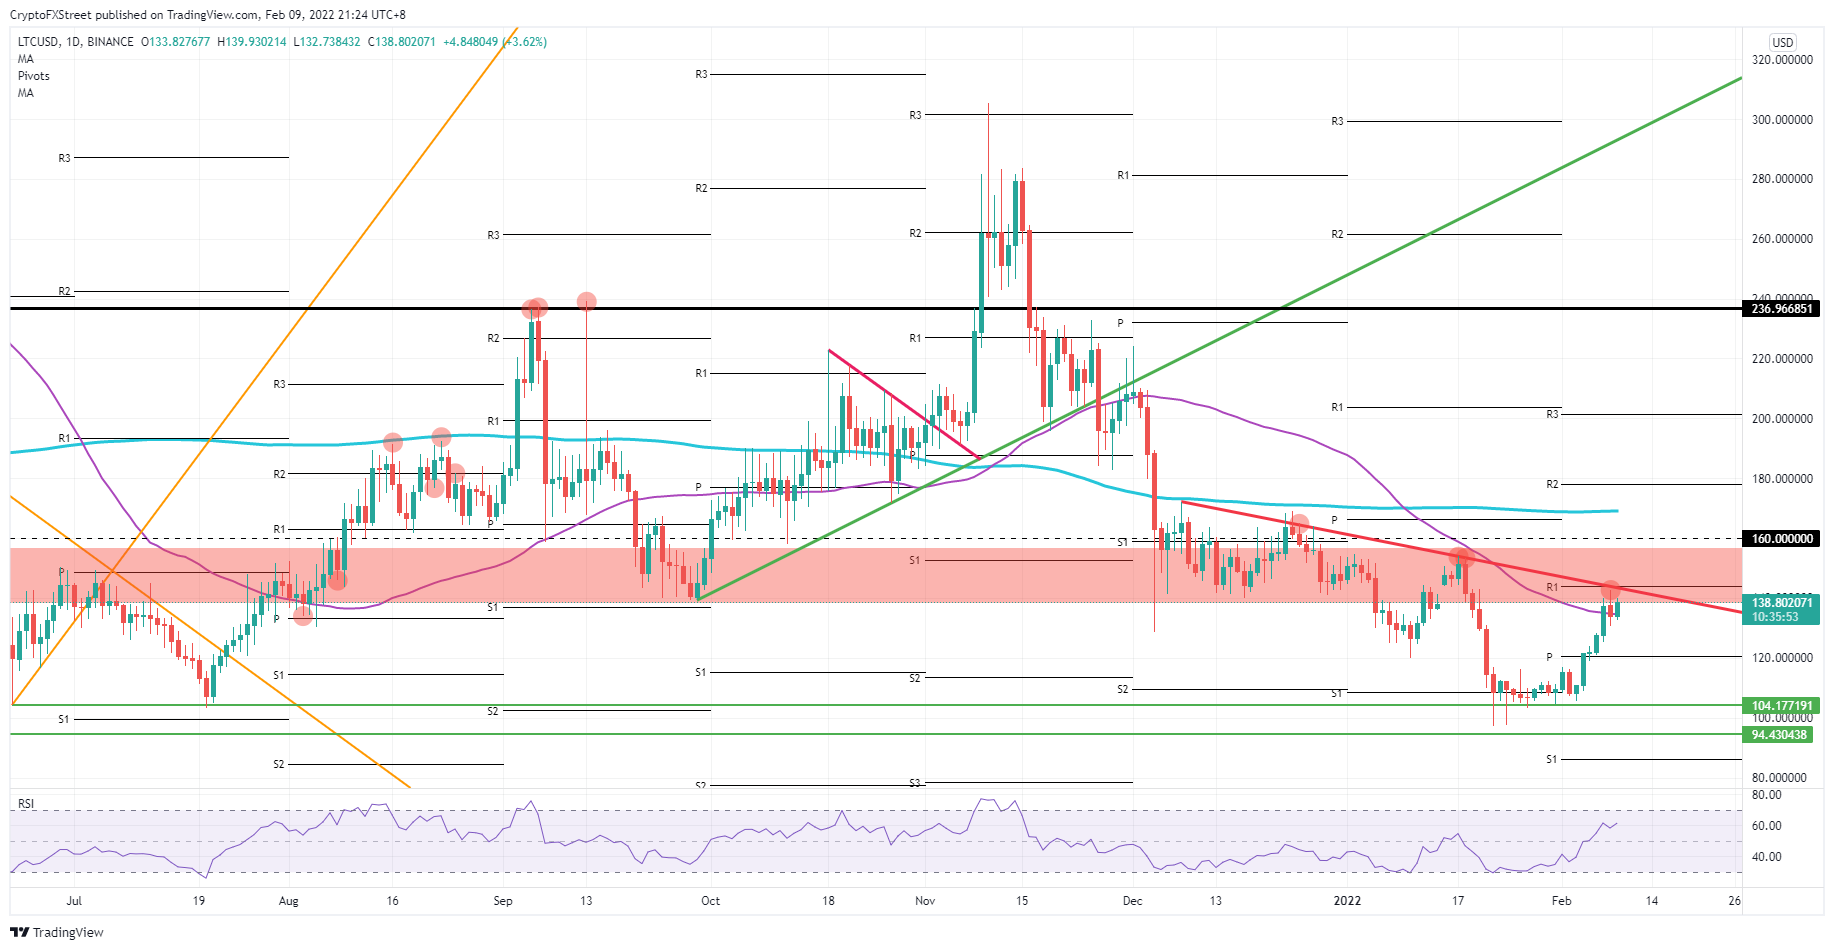
LTC/USD daily chart

LTC/USD daily chart

As the hurdles at $140 already proved too big for bulls to get over, that could still be the case today. With the risk of price action being rejected again, expect a more extensive downward move, with the 55-day SMA not supportive enough and price probably falling back to $120. At that level, bulls have the monthly pivot for an entry to make another attempt at the red descending trend line in a few weeks time.


Information on these pages contains forward-looking statements that involve risks and uncertainties. Markets and instruments profiled on this page are for informational purposes only and should not in any way come across as a recommendation to buy or sell in these assets. You should do your own thorough research before making any investment decisions. FXStreet does not in any way guarantee that this information is free from mistakes, errors, or material misstatements. It also does not guarantee that this information is of a timely nature. Investing in Open Markets involves a great deal of risk, including the loss of all or a portion of your investment, as well as emotional distress. All risks, losses and costs associated with investing, including total loss of principal, are your responsibility. The views and opinions expressed in this article are those of the authors and do not necessarily reflect the official policy or position of FXStreet nor its advertisers. The author will not be held responsible for information that is found at the end of links posted on this page.

If not otherwise explicitly mentioned in the body of the article, at the time of writing, the author has no position in any stock mentioned in this article and no business relationship with any company mentioned. The author has not received compensation for writing this article, other than from FXStreet.

FXStreet and the author do not provide personalized recommendations. The author makes no representations as to the accuracy, completeness, or suitability of this information. FXStreet and the author will not be liable for any errors, omissions or any losses, injuries or damages arising from this information and its display or use. Errors and omissions excepted.

The author and FXStreet are not registered investment advisors and nothing in this article is intended to be investment advice.

Recommended content


Recommended Content

Editors’ Picks

The crypto market is stuck in the mud

The crypto market is stuck in the mud

The crypto market has been hovering in a narrow range for the past four days, adding just over 2.5% over the past seven days to $2.72 trillion. These are levels below the 200-day moving average, indicating that the balance of power is now on the sellers' side.

More Cryptocurrencies News
Fintech and crypto firms push for bank licenses under Trump administration

Fintech and crypto firms push for bank licenses under Trump administration

Fintech and crypto firms seek bank charters under Trump, aiming for growth, lower costs, and legitimacy amid expectations of a more business-friendly regulation.

More Cryptocurrencies News
ETH consolidates below $2,000 as Standard Chartered alters its prediction for 2025

ETH consolidates below $2,000 as Standard Chartered alters its prediction for 2025

Standard Chartered analysts led by Geoffrey Kendrick lowered the bank's expectations for Ethereum's price in 2025. The bank adjusted its latest prediction, reducing Ethereum's 2025 price target from $10,000 to $4,000.

More Ethereum News
Solana price faces 50-day resistance as SOL futures debut on CME Group with $5M volume on fifth anniversary

Solana price faces 50-day resistance as SOL futures debut on CME Group with $5M volume on fifth anniversary

Solana (SOL) stagnated around the $128 mark on Monday despite multiple bullish catalysts. The recent SOL unlocks by Alameda Research, ahead of FTX creditor repayments, have created a persistent bearish overhang since early March.

More Solana News
Bitcoin: BTC at risk of $75,000 reversal as Trump’s trade war overshadows US easing inflation

Bitcoin: BTC at risk of $75,000 reversal as Trump’s trade war overshadows US easing inflation

Bitcoin price remained constrained within a tight 8% channel between $76,000 and $84,472 this week. With conflicting market catalysts preventing prolonged directional swings, here are key factors that moved BTC prices this week, as well as key indicators to watch in the weeks ahead. 

Read full analysis
The Best brokers to trade EUR/USD

The Best brokers to trade EUR/USD

SPONSORED Discover the top brokers for trading EUR/USD in 2025. Our list features brokers with competitive spreads, fast execution, and powerful platforms. Whether you're a beginner or an expert, find the right partner to navigate the dynamic Forex market.

Read More

BTC

ETH

XRP