|

Litecoin price hits strong barrier but has a lot of support on the way down - Confluence Detector

  • Litecoin price seems to have hit a strong resistance level.
  • The digital asset could be poised for a short-term correction although it has a lot of support below.

Litecoin hit a high of $185 on January 10 and has been consolidating since then. The digital asset hasn’t really benefited from Ethereum’s breakout in the past few days and continues slowly climbing towards the last high.

Litecoin price faces short-term pressure

On the 4-hour chart, the TD Sequential indicator has just presented a sell signal which in the past has been quite reliable. The call has already some bearish continuation and could drop Litecoin price towards the 100-SMA at $154 or the 50-SMA at $144.

ltc price

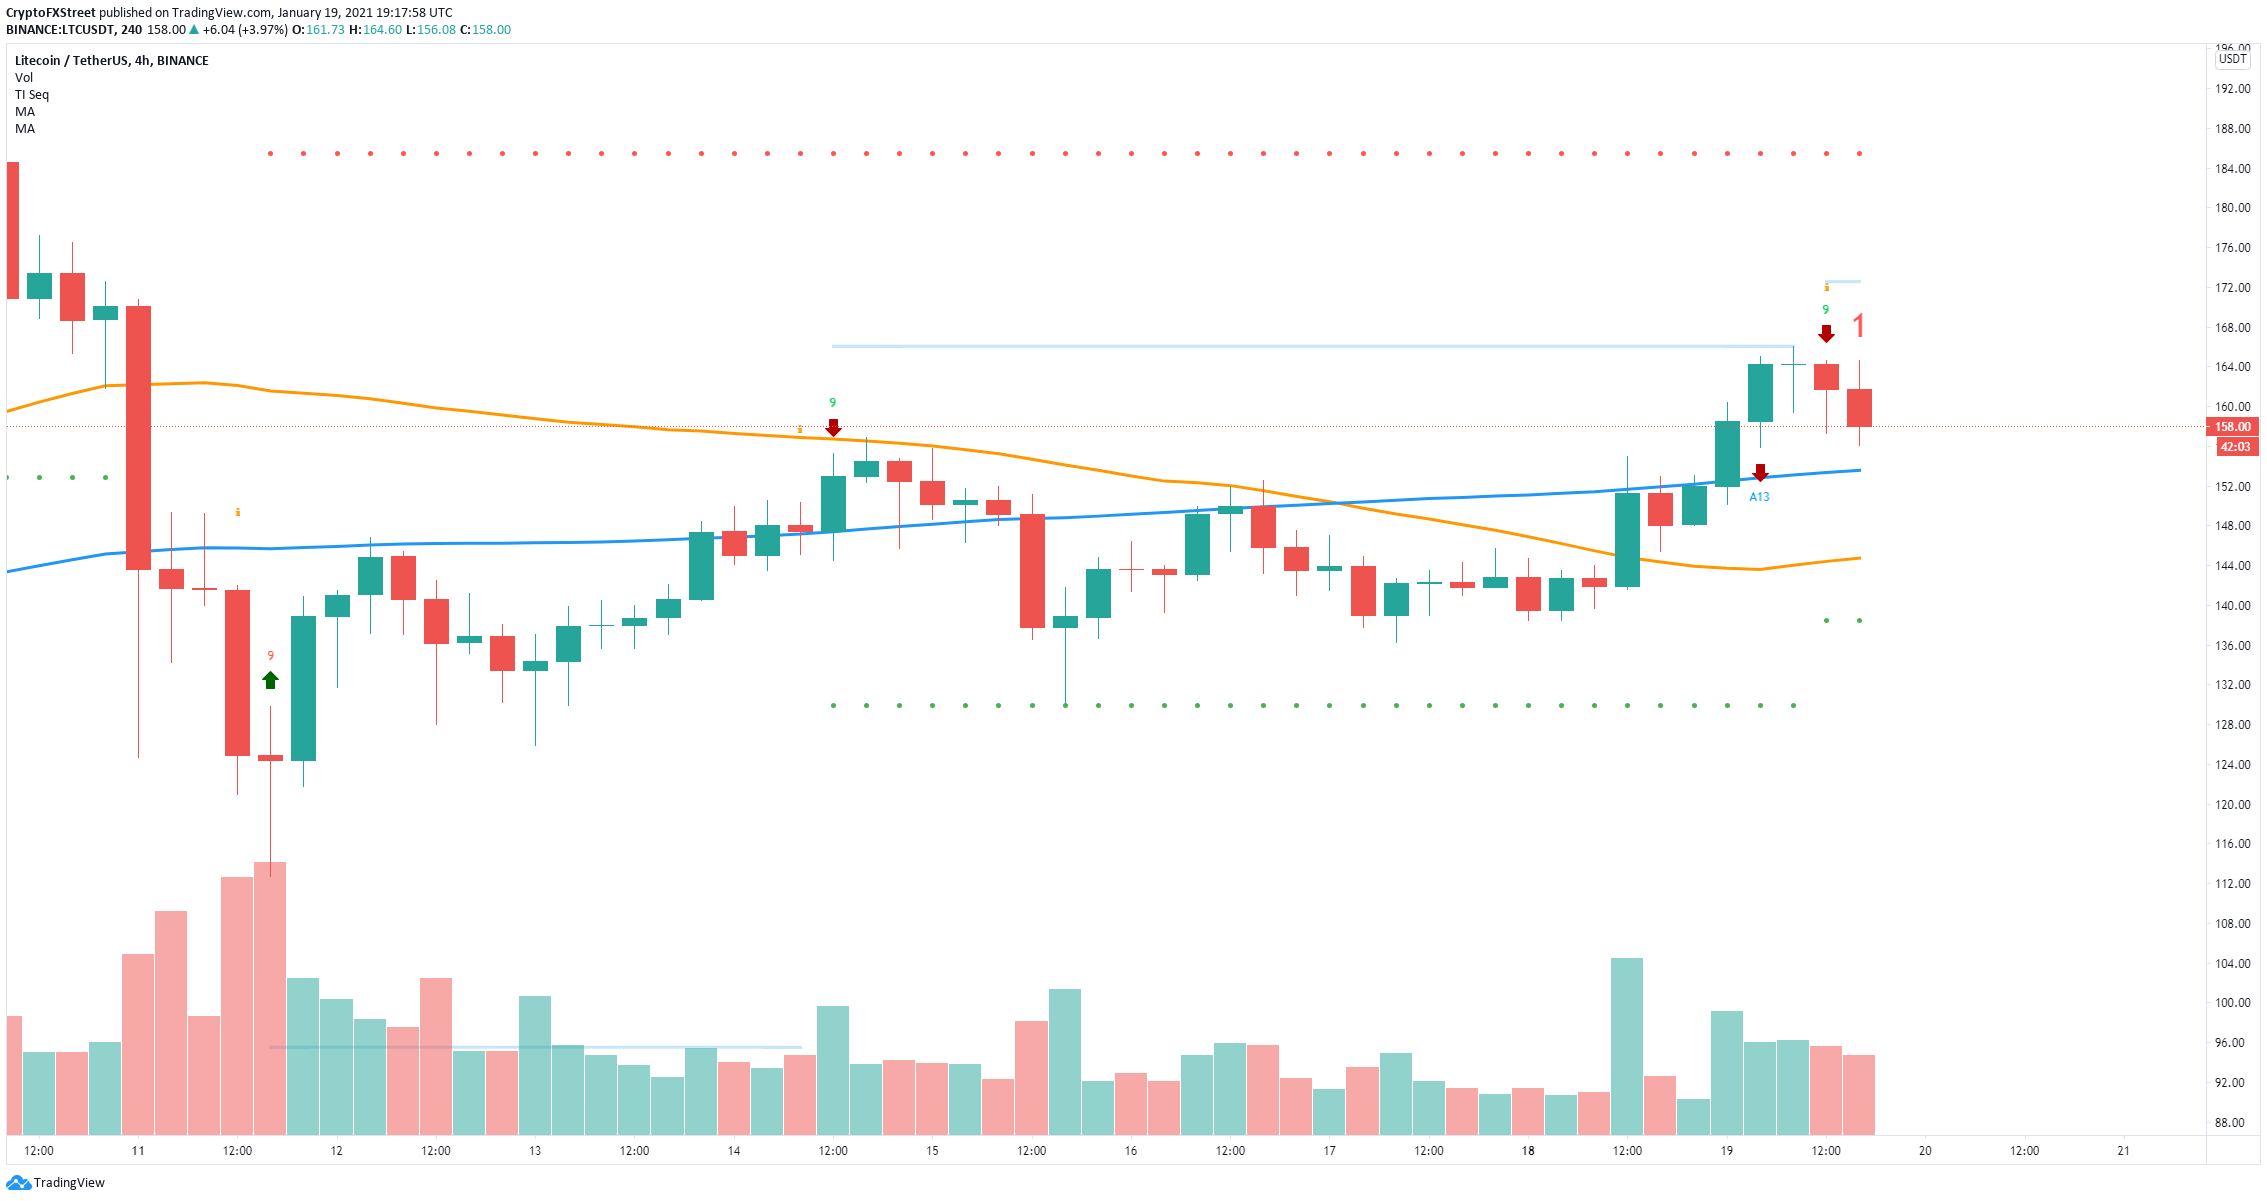
LTC/USD 4-hour chart

However, the In/Out of the Money Around Price (IOMAP) chart shows strong support below $158 and two critical support areas between $144 and $149 and another between $139 and $144 which coincide with the bearish price targets mentioned above.

ltc price

LTC IOMAP chart

On the way up, Litecoin price faces practically no resistance when compared to the support below with the most significant range between $172 and $177. 

The confluence detector shows a stiff resistance level at $157 which is the 61.8% Fibonacci level on the weekly chart. In addition to this point, the Pivot Point 1 Day R1 at $158 could also pose some trouble for the bulls.
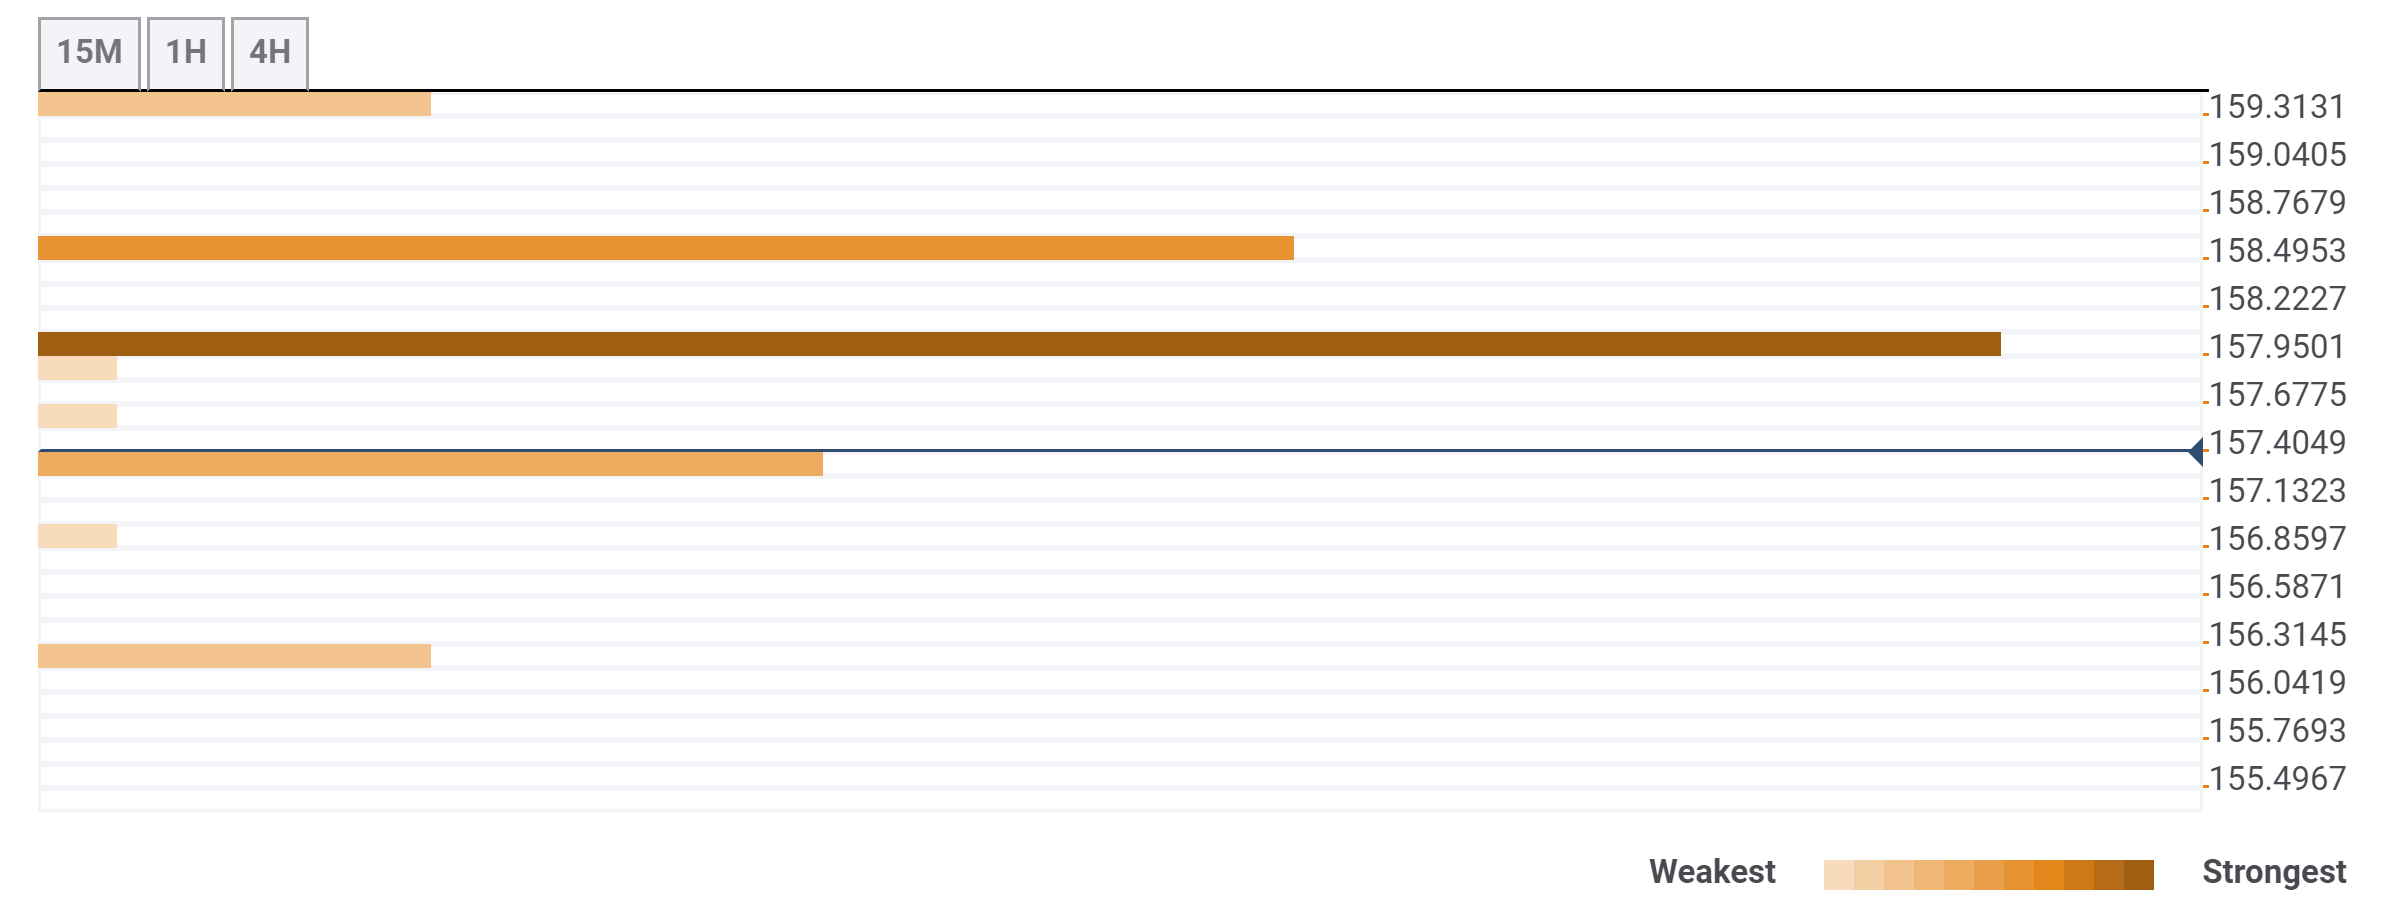
ltc price

LTC confluences

On the way down we find very little support close to the current price. The $157.1 level where the 100-SMA on the 15-minutes chart and the previous low on the 4-hour chart converge is the most significant support point.

Author

Lorenzo Stroe

Lorenzo Stroe

Independent Analyst

Lorenzo is an experienced Technical Analyst and Content Writer who has been working in the cryptocurrency industry since 2012. He also has a passion for trading.

More from Lorenzo Stroe
Share:

Editor's Picks

Top 3 Price Prediction: Bitcoin, Ethereum, Ripple deepen sell-off as bears take control of momentum

Bitcoin, Ethereum, and Ripple continued their corrections on Friday, posting weekly losses of nearly 6%, 3%, and 5%, respectively. BTC is nearing the November lows at $80,000, while ETH slips below $2,800 amid increasing downside pressure.

Shiba Inu Price Forecast: SHIB extends losses as whale selling intensifies bearish momentum

Shiba Inu (SHIB) price slips below $0.0000077 on Thursday after correcting the previous day. Bearish sentiment is further strengthened as holders offload SHIB, increasing selling pressure and reducing Open Interest in the derivatives market.

Top Crypto Losers: Worldcoin, Chiliz, Hyperliquid lead losses as market bleeds $1.75 billion

Worldcoin , Chiliz , and Hyperliquid posted heavy losses over the last 24 hours as Bitcoin dropped below $82,000 on Friday, triggering a $1.75 billion wipeout and mirroring the bearish tremors in the US stock market.

Fidelity unveils FIDD stablecoin, set to launch in coming weeks

Fidelity Investments announced that it will launch its first stablecoin, the Fidelity Digital Dollar (FIDD), making it one of the first large traditional firms in the US to do so.

Bitcoin Price Annual Forecast: BTC holds long-term bullish structure heading into 2026

Bitcoin (BTC) is wrapping up 2025 as one of its most eventful years, defined by unprecedented institutional participation, major regulatory developments, and extreme price volatility.

Bitcoin: BTC correction deepens as Fed stance, US-Iran risks, mining disruptions weigh

Bitcoin (BTC) price extends correction, trading below $82,000 after sliding more than 5% so far this week. The bearish price action in BTC was fueled by fading institutional demand, as evidenced by spot Exchange-Traded Funds (ETFs), which recorded $978 million in inflows through Thursday.