Litecoin Price Forecast: LTC hints at a 15% correction if these key conditions are met
- Litecoin price suggests a potential 15% correction after the sweep of the $70.69 range high.
- Depending on the 12-hour RSI’s encounter with the mean level of 50 LTC could either rally or slide lower.
- Invalidation of the bearish outlook will occur on the flip of the $70.69 hurdle into a support floor.


Litecoin (LTC) price shows sigs of exhaustion after its recent upswing. If profit-taking turns into panic selling, then the chances of a steep correction are high for LTC holders.
Read more: Litecoin Price Prediction: LTC to mark new 2023 low as whales’ inactivity hits a three-year high
Litecoin price in a tough position
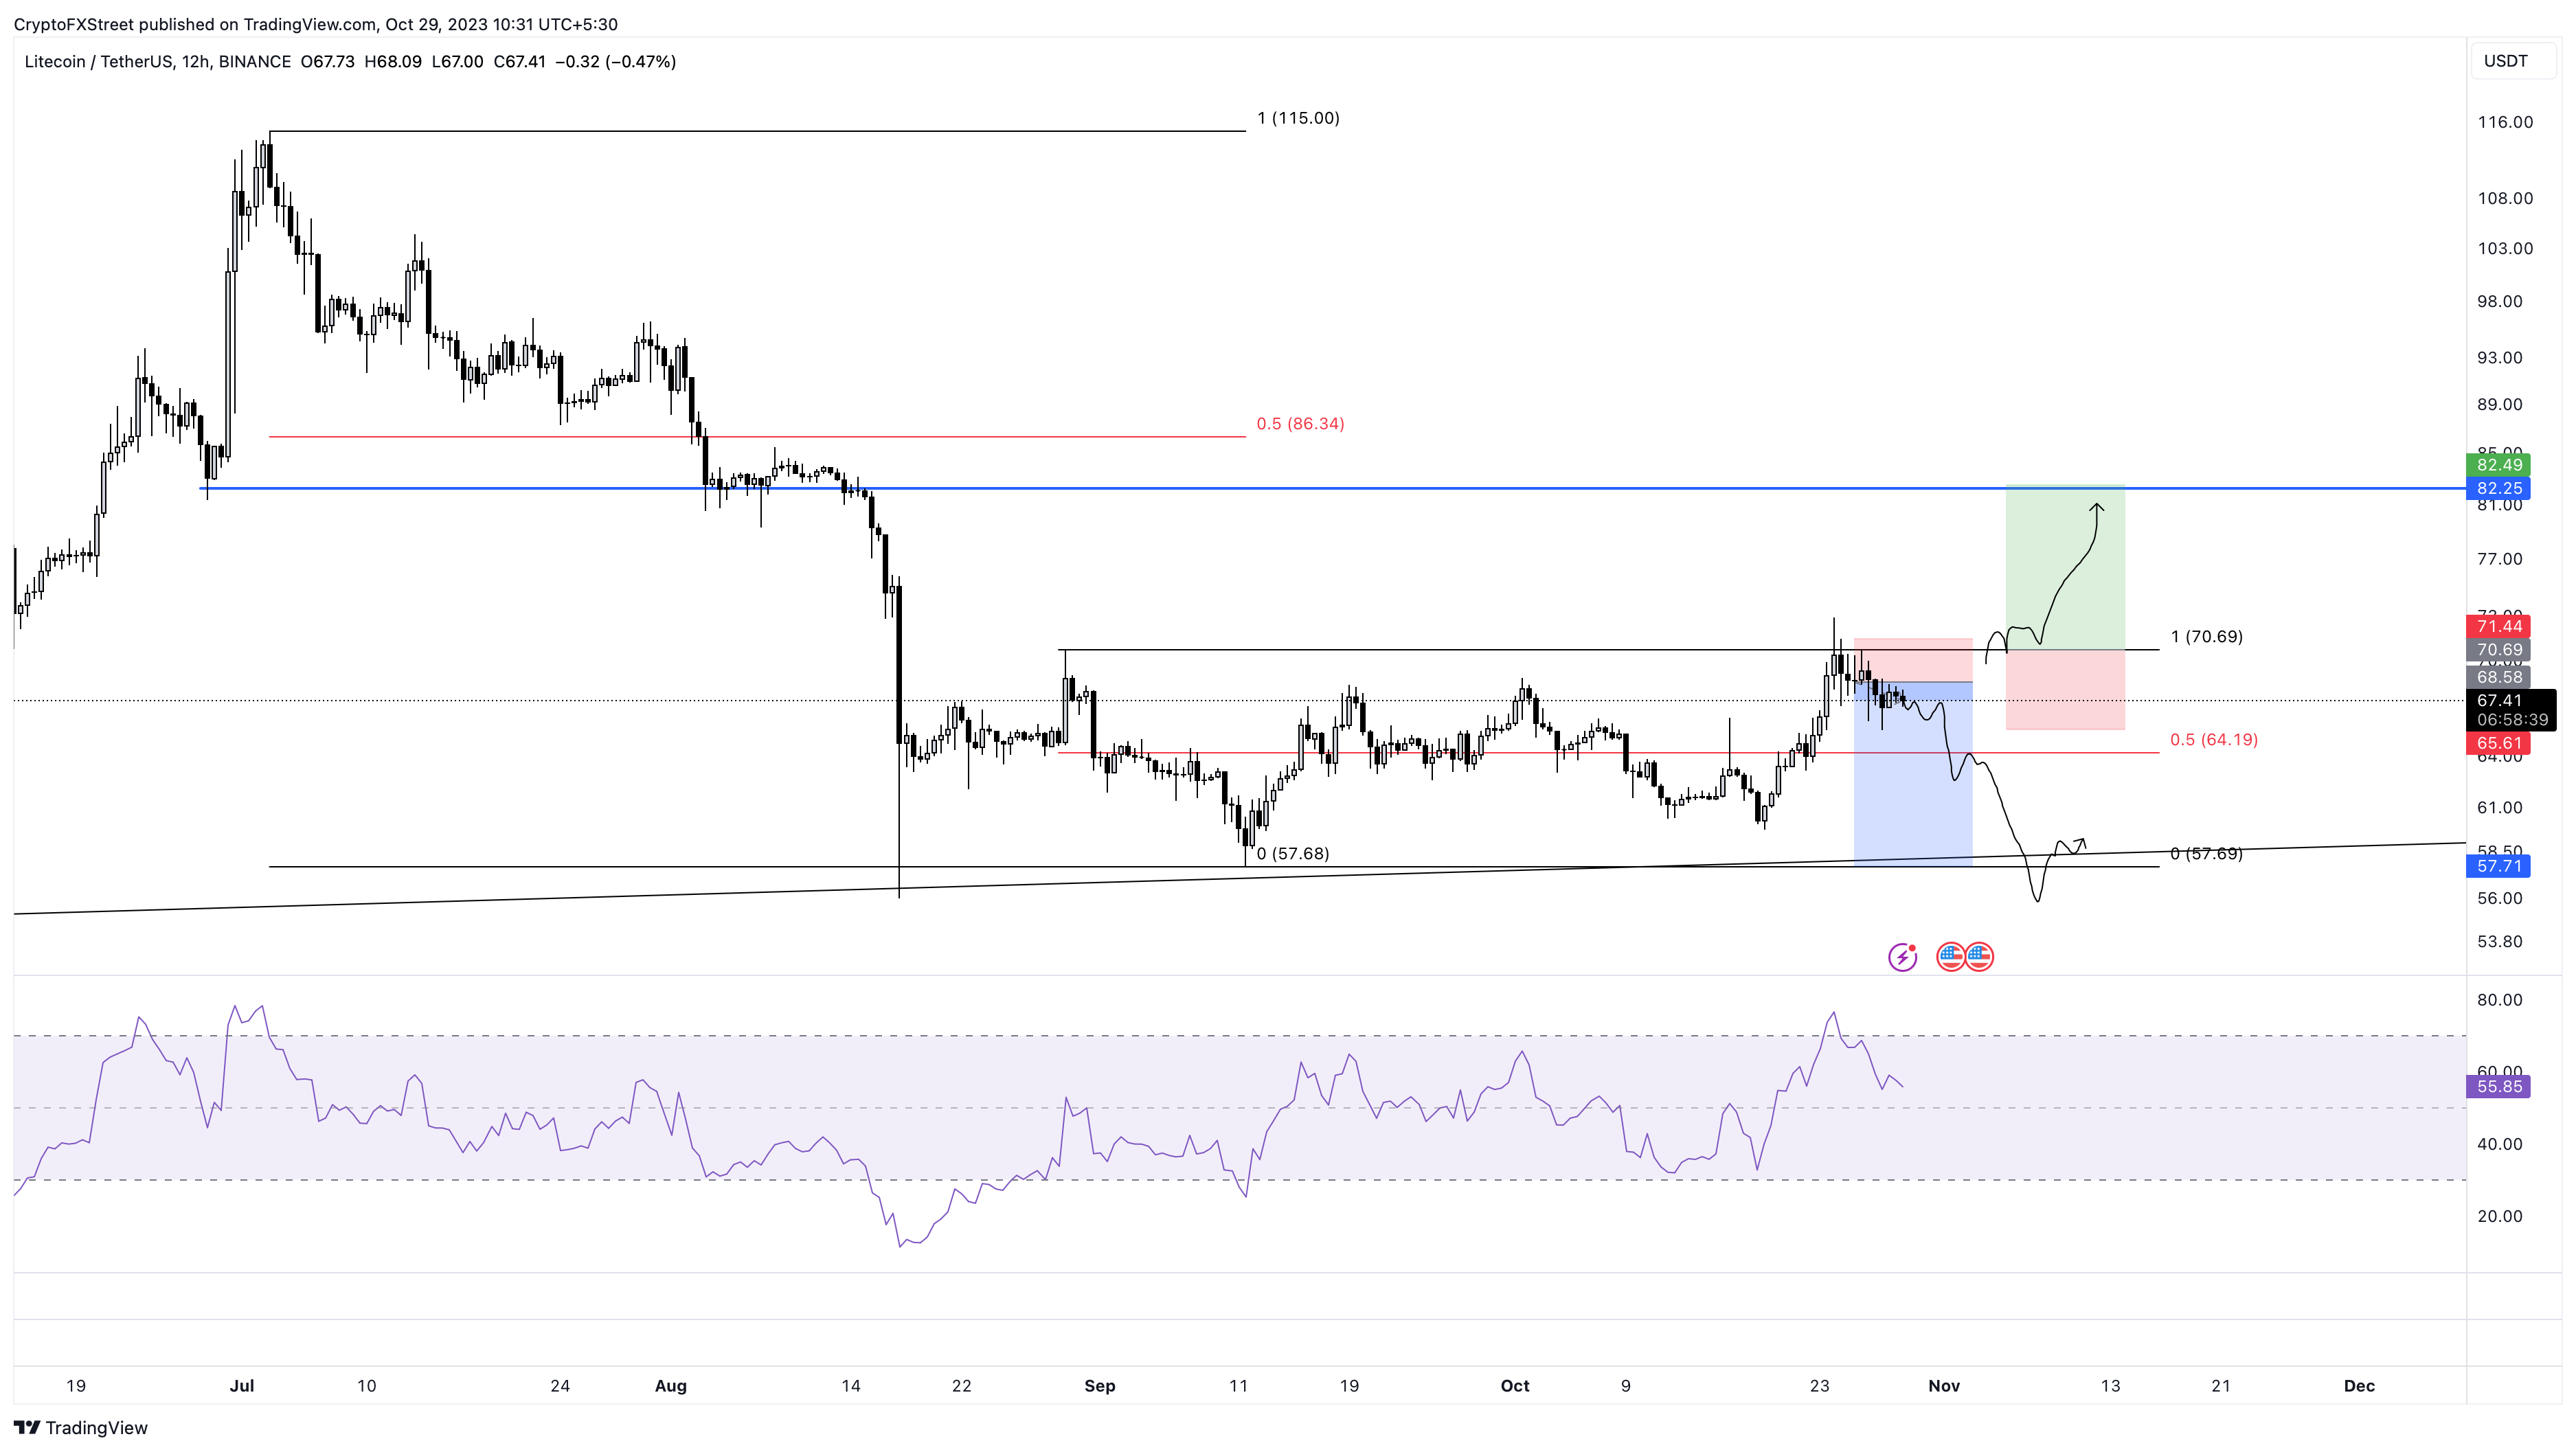
Litecoin (LTC) price set up a range, extending from $57.69 to $70.69 between August 29 and September 11. Since the formation of this range, LTC has swept the range high and set up a local top at $72.89 on October 24. The subsequent profit-taking has pushed the altcoin back inside the range.
As Litecoin price trades at $67.40, investors can expect a continuation of the pullback. On the 12-hour chart, the Relative Strength Index (RSI) which sits above 50 has a key role to play. A bounce off the mean level could hold the key to making or breaking LTC’s next move.
A failure from bulls could trigger a breakdown of the RSI’s 50 level, which is likely to enforce a bearish outlook. In such a case, Litecoin price could slide lower and aim for the sell-side liquidity resting below the October 19 swing low of $59.70. But in an ideal rangebound scenario, LTC could sweep the range low of $57.69.
This move would constitute a 15% descent and is likely where Litecoin price will consolidate before deciding on its next move.
Read more: Litecoin price is failing recovery as Whales pull back to December 2020 lows
LTC/USDT 12-hour chart
While the rangebound bearish outlook makes logical sense, the correction is dependent on how the 12-hour RSI plays out. If there is a show of strong demand as RSI touches the 50 level, then investors can expect Litecoin price to attempt to flip the range high of $70.69.
A decisive flip of this hurdle into a support floor will invalidate the bearish thesis. In such a case, Litecoin price could revisit the $82.25 hurdle after a 16% upswing.
Author
Akash Girimath
FXStreet
Akash Girimath is a Mechanical Engineer interested in the chaos of the financial markets. Trying to make sense of this convoluted yet fascinating space, he switched his engineering job to become a crypto reporter and analyst.